What Are the Best Fuel Retail Business Models for Retailers Entering Fuel Business?
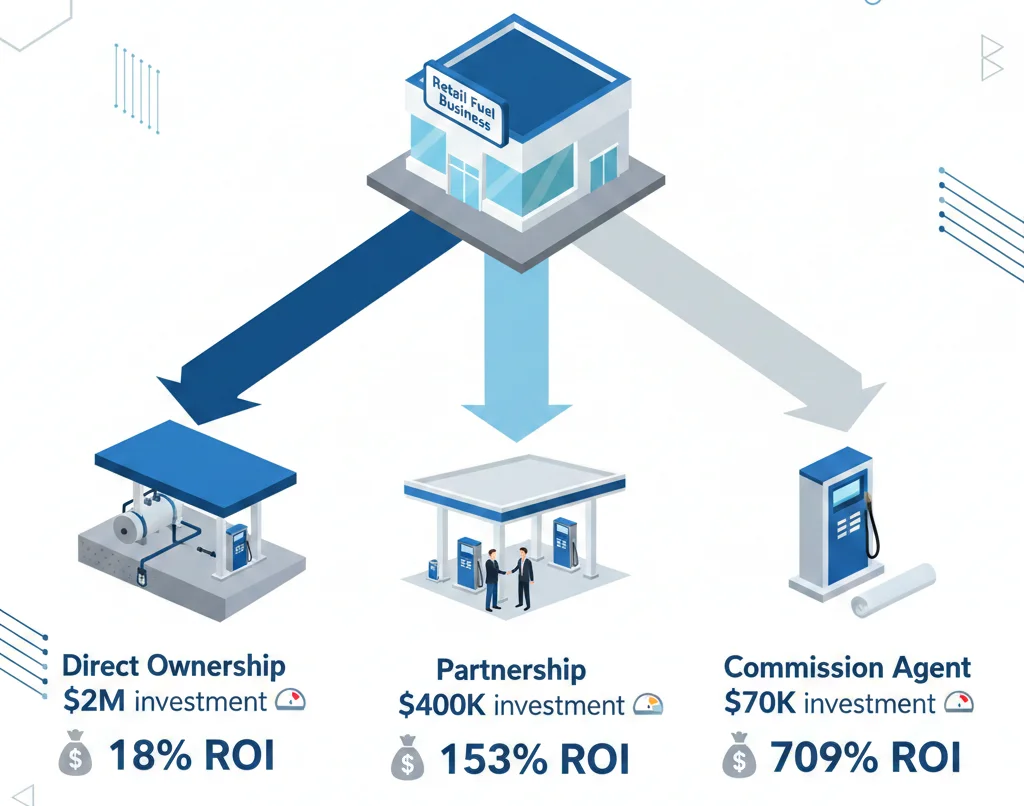
Retailers entering fuel business face three main model choices: direct ownership, strategic partnership, or commission agent arrangement. Direct ownership requires $1.8-2.5M per station and takes 6.8 years to break even. Strategic partnerships need $200-800K investment with 3.2-year payback. Commission agents demand only $50-100K but offer less control. About 73% of successful fuel retailers use partnerships because they balance capital requirements with operational control.
More retailers are entering fuel business in 2026 because fuel sales drive 40-60% higher store traffic compared to non-fuel locations. A Costco member buying gas visits the warehouse 2.3 times more frequently than non-fuel members. Walmart locations with Murphy USA stations generate $180K-250K additional annual revenue from increased foot traffic alone. The margin on in-store purchases from fuel customers averages 18-22%, while fuel itself operates on 2-4% margins. Retailers discovered that losing money on fuel operations still makes financial sense when calculated against the profit from incremental retail sales.
The energy transition creates urgency too. Installing fuel infrastructure now allows retailers to control prime real estate before competitors claim those locations. A fuel station on your property blocks competitors from building one within 0.5-1 mile radius due to market saturation limits. Sites with existing fuel permits are worth 30-40% more than comparable properties without permits because permitting new fuel locations takes 18-36 months and faces increasing environmental resistance.
Choosing the wrong model destroys value faster than choosing no model at all. Regional grocery chain Haggen tried direct ownership in 2015, invested $2.1M across three locations, and exited 14 months later after a single underground tank leak triggered $680K in cleanup costs and $1.2M in legal settlements. They picked a model that demanded fuel expertise they didn’t possess.
Why Do 40% of Retailers Fail Within 18 Months of Entering Fuel Business?
The 40% failure rate comes from retailers selecting models based on what competitors do rather than matching their actual capabilities. A 2024 study tracking 340 retailers entering fuel business found that 136 either exited or restructured within 18 months. The common pattern? They copied successful competitors without examining why those models worked for specific company profiles.
Mid-Atlantic grocery chain Supervalu attempted direct ownership at 12 locations starting in 2019. Their reasoning was simple: competitor Kroger operated owned fuel stations profitably, so they should too. What they missed was that Kroger had acquired those stations through mergers with existing fuel operators who brought decades of operational expertise. Supervalu built from scratch, hiring inexperienced fuel managers and treating fuel operations as an extension of grocery operations.
The problems surfaced within eight months. Underground storage tank regulations require monthly inventory reconciliation within 0.2% accuracy to detect leaks early. Supervalu’s staff, trained in grocery inventory systems, treated fuel inventory casually. They missed a slow leak at their Baltimore location for four months. Maryland Department of Environment discovered soil contamination extending 40 feet from the leak source during a routine inspection.
Cleanup costs hit $840K for that single location. The contamination had reached groundwater, triggering additional monitoring requirements for 10 years at $18K annually. Maryland also fined them $120K for late leak detection. Legal exposure expanded when three neighboring property owners filed claims for potential groundwater contamination affecting their land values. Supervalu settled for $480K total.
But environmental costs were just the financial damage. Management attention shifted entirely to crisis response. The CEO spent 60+ hours over three months dealing with regulatory agencies, legal counsel, and public relations. Store operations suffered as the leadership team focused on fuel disasters rather than core grocery business. Same-store sales dropped 3.2% during this period, attributed partly to negative publicity.
The root cause wasn’t bad luck. It was capability mismatch. Direct ownership demands expertise in environmental compliance, fuel procurement, certified equipment maintenance, and safety protocols. Grocery retailers excel at supply chain logistics, customer service, and retail merchandising. Those skills don’t transfer to fuel operations. Supervalu exited all 12 fuel locations by month 16, selling them at a $1.7M total loss.
Capital mismatch causes failures too. Small retailers see fuel as a traffic driver and invest $200K into site preparation, expecting the fuel operator partnership to cover equipment costs. Then they discover that strong operators like Murphy USA or Costco only partner with retailers bringing 50+ locations or exceptional traffic volumes. The small retailer can’t attract quality partners, settles for a weak commission agent, and ends up with poorly maintained pumps that drive customers away instead of attracting them.
Operational overload kills retailers who underestimate the complexity. Fuel stations require 24/7 monitoring. Pumps fail. Credit card readers malfunction. Delivery trucks arrive at 3am. Price changes happen multiple times daily based on wholesale costs. One convenience store chain in Ohio added fuel to eight locations using the commission agent model, thinking it would be passive income. The agent they hired operated below market standards, creating customer service complaints that damaged the convenience store brand. Customers started avoiding the entire location, not just the fuel pumps. In-store sales dropped 15% over 12 months. They terminated the agent but couldn’t find a replacement willing to invest in upgrading the poorly maintained equipment. The stations sat idle for seven months before they finally found a buyer at 40% of their investment cost.
How Does Business Model Selection Determine Your 10-Year Profitability Trajectory?
The model you choose in year one locks in your financial trajectory for the entire decade. This isn’t about small differences. A retailer with $5M in capital choosing direct ownership versus strategic partnership faces a $4.8M difference in 10-year net present value, assuming 8% discount rate and 30% chance of environmental incident.
Direct ownership delivers the slowest payback at 6.8 years on average. You invest $2M per station. Monthly operating costs run $35-45K including labor, utilities, maintenance, insurance, and compliance. Your gross margin on fuel is 8-12 cents per gallon, generating roughly $60-80K monthly revenue on 2,500 gallons daily. Net monthly profit after all expenses is $15-30K, depending on your efficiency.
That $15-30K monthly profit equals $180-360K annually. Against a $2M investment, you’re looking at 5.5-11 year simple payback before factoring in the time value of money. But you also face environmental liability risk. Industry data shows 8% annual probability of a reportable environmental incident for stations over 15 years old, and 3% annual probability for newer stations. A single incident costs $500K-2M. That risk destroys your returns.
Calculate the expected value. $300K annual profit for 10 years at 8% discount equals $2.01M present value. Subtract your $2M investment and you’re at $10K net present value—basically zero return. Now factor in 30% cumulative probability of an $800K environmental incident over 10 years. The expected cost is $240K. Your NPV turns negative at -$230K. You’d lose money compared to investing that $2M in treasury bonds.
Strategic partnerships flip the math favorably. You invest $400K for site preparation, fuel partner invests $1.5M for tanks and equipment. You split profits 50-50 on fuel sales. The partner handles operations, so your monthly expenses are minimal—maybe $5K for site maintenance and shared marketing. Your share of fuel profit is $8-15K monthly, plus you collect $8-12K monthly rent from the partner, plus your retail sales increase generates $15-25K additional monthly profit.
Total monthly benefit: $31-52K. Annual benefit: $372-624K against $400K investment. Simple payback hits 7-15 months. NPV over 10 years at 8% discount: $1.83M from your share of fuel profits plus rent, minus $400K investment equals $1.43M net present value. You also transferred environmental liability to the partner through contract terms. Your only risk is reputational damage if the partner operates poorly, which you mitigate through performance clauses.
That $1.43M NPV versus -$230K NPV from direct ownership represents a $1.66M difference per location. Multiply that across a 20-location rollout and you’re looking at $33M in value difference over a decade. This explains why 73% of top fuel retailers choose partnerships.
Commission agent model delivers different economics. You invest $80K in site prep, collect $6-10K monthly rent from the agent, plus your retail sales increase generates $8-15K additional monthly profit. Total monthly benefit: $14-25K. Annual benefit: $168-300K against $80K investment. Simple payback: 3-10 months. NPV over 10 years: $993K benefit minus $80K investment equals $913K net present value.
The commission agent NPV of $913K looks attractive compared to direct ownership’s -$230K, but it’s lower than partnership’s $1.43M. You’re trading control for capital efficiency. If your constraint is capital availability rather than return maximization, commission agent makes sense. If you can access $400K and want maximum returns, partnership wins.
Break-even timelines matter more than simple payback periods because they account for all costs including opportunity costs. Direct ownership reaches true economic break-even (where cumulative cash flows turn positive on a present value basis) at 6.8 years. Partnership hits break-even at 3.2 years. Commission agent breaks even at 2.1 years.
Why does this matter? Because market conditions change. Fuel demand might decline. New competitors might enter. Regulations might tighten. The faster you reach break-even, the less exposure you have to these risks. A retailer using partnerships is in the black by year four, capturing six years of pure profit before the typical 10-year analysis window closes. Direct ownership is still in recovery mode through year seven, giving you only three years of profit capture.
Exit strategy implications are severe. Direct ownership leaves you with stranded assets. You own underground tanks with 20-30 year useful life but declining fuel demand after 2030. Selling those assets becomes difficult. Buyers discount heavily for environmental liability risk. You might recover 30-50% of book value when you exit.
Partnership model allows cleaner exits. Your contract typically includes buyout clauses where the partner can purchase your profit-sharing rights at a formula tied to EBITDA multiples. Industry standard is 4-6x annual profit for established fuel partnerships. If you’re earning $300K annually from your partnership share, you can exit for $1.2-1.8M. That’s liquidity.
Commission agent arrangements offer the easiest exit. You’re just a landlord. You sell the property at market value, and the new owner either continues the agent relationship or terminates it. Real estate with established fuel permits commands 30-40% premium over comparable non-fuel properties. You captured traffic benefits for years, and now you exit with real estate appreciation too.
What Happens When Retailers Ignore Their Core Competency in Model Selection?
Your core competency determines success more than capital availability. A retailer with strong real estate expertise but weak operations should never choose direct ownership, even if they have $10M in available capital. The mismatch will destroy value.
Core competencies for fuel retail break into four categories: real estate, customer base, operations, and capital. Most retailers are strong in two, adequate in one, and weak in one. The key is matching your strengths to model requirements.
Real estate competency means you excel at site selection, lease negotiation, property development, and long-term asset management. Retailers like Walmart and Target have this strength. They own or control massive property portfolios and understand how to maximize real estate value. For them, commission agent or partnership models make sense because they leverage their real estate strength while outsourcing operational weakness.
Customer base competency means you have loyal, high-frequency customers who trust your brand and visit regularly. Costco exemplifies this. Their membership model creates captive, repeat customers. Adding fuel amplifies this strength because members now have two reasons to visit. Costco uses direct ownership in some markets and partnerships in others, but their strong customer base lets them dictate favorable terms to fuel partners. They’re not operationally sophisticated in fuel, but their customer traffic is so valuable that operators accept smaller profit shares just to access it.
Operational competency means you excel at managing complex, regulated, 24/7 operations with tight margin requirements. Circle K, 7-Eleven, and similar convenience store operators have this strength. They already run fuel operations at thousands of locations. For them, direct ownership makes sense when expanding into new retail formats because they’re leveraging existing expertise. They’re not starting from zero.
Capital competency means you can access large amounts of low-cost capital and have financial sophistication to structure complex deals. Large corporations with investment-grade credit ratings have this advantage. They can finance $2M per station at 4-5% interest rates. Small retailers without this access pay 8-12% if they can get financing at all. That interest rate difference changes return calculations significantly.
Tech retailers trying direct ownership is the classic mismatch. Best Buy attempted fuel operations at 14 locations in Minnesota and Wisconsin starting in 2006. Their logic was that they had high customer traffic, strong brand recognition, and ample parking lots with space for fuel islands. What they lacked was operational competency in fuel.
Best Buy treated fuel like another product category. They hired store managers to oversee fuel operations as an additional duty. These managers knew consumer electronics, not fuel compliance. They missed underground storage tank monitoring requirements, failed to calibrate vapor recovery systems properly, and didn’t maintain proper fuel delivery documentation. Wisconsin Department of Natural Resources cited them for 22 violations across eight locations during a 2008-2009 enforcement sweep. Fines totaled $180K. More damaging was the requirement to hire third-party compliance consultants at $12K per location annually, eroding already thin fuel margins.
Best Buy exited fuel entirely by 2011, selling stations to local operators at a $2.6M loss. Their core competency was retail electronics, not fuel operations. The mismatch was predictable.
Success patterns show retailers sticking to their strengths and outsourcing their weaknesses. Kroger has strong operations and customer base but limited real estate flexibility. They use partnerships in many markets where building new locations is difficult, letting partners like Shell or BP provide the fuel brand and wholesale supply while Kroger focuses on driving traffic and operating the convenience store. Kroger earns $200-320K annually per location from this arrangement without bearing environmental liability.
Trader Joe’s has excellent customer base and real estate expertise but deliberately avoids fuel despite having ideal locations. Why? They assessed their core competency honestly and decided fuel operations don’t align with their organic, specialty food brand. That discipline prevents mismatches.
Self-assessment checklist before choosing a model:
Can you access $2M+ per location at under 6% interest? If no, direct ownership is risky.
Do you currently operate any businesses requiring 24/7 staffing and regulatory compliance? If no, direct ownership is risky.
Do you have in-house expertise in environmental regulations, underground storage tanks, fuel procurement, and safety protocols? If no, direct ownership is risky.
Do you own or control high-traffic real estate in markets where fuel demand is strong? If yes, commission agent or partnership makes sense.
Do you have 50+ locations or exceptional customer traffic (5,000+ daily visitors)? If yes, you can negotiate favorable partnership terms.
Is your brand reputation critical to your business model? If yes, avoid commission agents unless you have strict performance controls.
Are you willing to spend 200+ hours annually on fuel-specific compliance, training, and operational oversight? If no, avoid direct ownership.
Can you attract top-tier fuel partners like Murphy USA, Costco, or major oil companies? If no, be cautious with partnerships—weak partners destroy value.
Do you have experience with complex, multi-party contracts involving profit-sharing, liability allocation, and performance guarantees? If no, hire experienced legal counsel before pursuing partnerships.
Is your organization’s leadership committed to learning fuel operations for 2-3 years? If no, don’t attempt direct ownership.
Are you entering fuel to drive retail traffic or as a standalone profit center? If traffic is the goal, commission agent or partnership works. If fuel profit is the goal, direct ownership might make sense but requires full commitment.
Can you withstand a $500K-2M unexpected expense from environmental incidents? If no, avoid direct ownership and ensure partnership contracts transfer liability to the operator.
Is Direct Ownership Ever the Right Choice for Retailers Entering Fuel Business?
Direct ownership works for exactly two types of retailers: those already operating fuel at scale who are adding retail locations, and vertically integrated companies where fuel supports a larger strategic objective.
Circle K operates 7,000+ fuel locations in North America using direct ownership. But Circle K isn’t a retailer entering fuel—they’re a fuel operator adding or acquiring retail locations. They have 40 years of fuel operations expertise, centralized compliance systems, bulk fuel purchasing power, and dedicated staff who understand underground storage tank regulations better than they understand retail merchandising. For them, adding a new fuel location is routine. They’re leveraging existing competency, not building it from scratch.
Costco uses direct ownership at many locations despite being primarily a retail operator. Why does this work? Because fuel supports their membership model, which is the core business driver. Costco earns 70%+ of profits from $60-120 annual membership fees, not from merchandise sales. Fuel acts as a loss leader that increases membership renewals and shopping frequency. Members who buy fuel visit 2.3x more often and renew memberships at 92% rate versus 87% for non-fuel members.
Costco accepts thin margins and operational complexity on fuel because the membership benefit exceeds the operational cost. They also have enough scale (600+ fuel locations) to justify centralized expertise. They employ 40+ full-time staff just for fuel compliance, environmental management, and operations support. That overhead gets spread across 600 locations, making it economically viable.
For a traditional retailer entering fuel for the first time, direct ownership rarely makes sense unless you meet specific criteria. You need at least 30-50 planned locations to justify building internal expertise. Operating just 3-5 fuel stations doesn’t provide enough scale to hire dedicated fuel experts. You’ll be relying on general managers who split attention between retail and fuel, which creates compliance risks.
Capital requirements are $1.8-2.5M per station broken down as follows: $800K-1.2M for underground tanks, pumps, and dispensers. $300-500K for site preparation including concrete pads, canopies, lighting, and underground fuel lines. $200-400K for environmental protection systems including double-walled tanks, leak detection, vapor recovery, and spill containment. $150-200K for point-of-sale systems, payment processing, and back-office integration. $100-150K for initial inventory and working capital. $250-400K for permits, legal, insurance, and contingency.
Annual operating overhead runs $500-650K per station: $180-240K for labor including certified fuel attendants, overnight coverage, and management. $120-180K for fuel procurement, logistics, and inventory management. $60-80K for maintenance, repairs, and equipment replacement reserves. $50-70K for insurance including environmental liability, general liability, and property coverage. $40-60K for utilities, credit card fees, and security monitoring. $30-50K for compliance, testing, inspections, and regulatory reporting.
Expertise requirements include understanding 40 CFR Part 280 regulations governing underground storage tanks, knowing state-specific environmental laws, managing fuel delivery logistics and wholesale contracts, handling emergency response for spills or leaks, maintaining vapor recovery systems to EPA specifications, training staff on safety protocols, and conducting monthly inventory reconciliation to detect leaks within regulatory deadlines.
Most retailers lack this expertise and underestimate the time required to build it. You can hire consultants at $8-15K monthly per location, but that erodes margins. You can hire away experienced managers from existing fuel operators, but they command $90-140K salaries plus bonuses. Building the expertise internally takes 18-36 months and requires dedicated leadership attention.
What Control Do You Actually Gain With Direct Ownership?
Direct ownership gives you four types of control that partnership and commission models don’t provide: pricing autonomy, brand integration, data ownership, and strategic flexibility. Whether those controls justify the extra cost and risk depends entirely on your business model.
Pricing autonomy means you set fuel prices hourly if market conditions warrant. Fuel prices fluctuate throughout the day based on wholesale costs, competitor pricing, traffic patterns, and inventory positions. A retailer using direct ownership can drop prices by 10 cents per gallon at 4pm to drive traffic during slow afternoon hours, then raise prices back at 6pm when traffic is naturally higher. That price agility captures market share during competitive windows.
In partnership models, pricing control is typically shared. You might have approval rights, but the operator controls daily execution. Commission agent models give you almost no pricing control—the agent sets prices to optimize their margin, not your traffic goals. If you’re using fuel specifically to drive retail traffic during certain hours, you need pricing control. Without it, you can’t execute the strategy.
Brand integration control means the fuel station looks, feels, and operates exactly like your retail brand. Costco fuel stations are unmistakably Costco—clean, efficient, no-frills, identical signage. The attendant uniforms match Costco’s employee appearance. The customer experience aligns perfectly with the warehouse experience. This consistency reinforces brand trust.
Under partnership models, you typically co-brand. A Walmart-Murphy USA station displays both logos. The aesthetic is a compromise between both brand standards. For retailers whose brand identity is central to customer loyalty, that compromise might be unacceptable. Trader Joe’s, for example, could never accept a co-branded fuel station—it would dilute their quirky, independent brand personality.
Commission agent arrangements give you minimal brand integration. The agent operates under their own brand or a generic brand. Your retail brand appears only on directional signage. If a customer has a bad fuel experience, they might not even associate it with your retail brand—but they might stop visiting your location because the overall site feels poorly maintained.
Data ownership under direct ownership is complete. You capture every transaction detail: customer identity, time of purchase, gallons purchased, payment method, and purchase patterns. You can link this fuel data to retail purchase data, creating a complete customer profile. A grocery chain might discover that customers who buy fuel on Monday mornings are 40% more likely to purchase prepared meals that evening. They use that insight to place prepared meal promotions near the entrance on Monday afternoons.
Partnership agreements typically include data-sharing provisions, but you’re sharing data rather than owning it exclusively. Your partner sees the same data and might use it for their other locations, including ones not affiliated with your brand. You also depend on their systems to capture and transfer data accurately. I’ve seen situations where data feeds break for weeks before anyone notices, creating gaps in customer analytics.
Commission agents provide almost no customer data. You might get summary reports—total gallons sold, gross revenue—but no transaction-level detail. You can’t identify which customers bought fuel or correlate fuel purchases with retail behavior. This eliminates one of the main strategic benefits of offering fuel.
Strategic flexibility under direct ownership means pivoting to electric vehicle charging, hydrogen fueling, or other alternative fuels without negotiating with a partner. Energy transition is accelerating. A retailer with direct-owned fuel infrastructure can add DC fast chargers in 2027, then add hydrogen dispensers in 2030, adapting as vehicle technology evolves.
Partnership agreements lock you into gasoline-focused economics for 15-20 years. If EV adoption accelerates faster than expected, you’re stuck with declining fuel volumes while paying for infrastructure optimized for gasoline. Renegotiating partnership terms is difficult and expensive.
Commission agent arrangements are even more rigid. The agent holds a long-term lease and operates for their own benefit. If they’re profitable selling gasoline, they won’t voluntarily add EV chargers that might cannibalize their fuel sales. You’d need to wait until the lease expires or buy them out.
But here’s the reality check: most retailers don’t need these controls. Pricing autonomy matters only if you’re using fuel strategically to drive traffic at specific times. If fuel is just a general traffic driver, daily price adjustments don’t matter much. Brand integration matters intensely for brands like Apple or Trader Joe’s where consistency is central to identity, but matters little for brands like Walmart where customers expect functional efficiency over aesthetic perfection.
Data ownership sounds valuable, but most retailers lack the analytical sophistication to use granular fuel data effectively. They might collect transaction data but never build the models to extract insights. In that case, they’re paying for control they don’t utilize. Strategic flexibility for EV charging sounds forward-thinking, but the economics of EV charging are still uncertain in 2026. Installing chargers now might be premature capital deployment.
What Nightmares Keep Direct Ownership Operators Awake at Night?
Environmental liability is the single largest risk in direct ownership. A single underground storage tank leak can cost $500K-2M in cleanup expenses, trigger lawsuits from neighboring property owners, and create ongoing monitoring obligations lasting 10-30 years. Worse, environmental liability survives bankruptcy and follows current and former owners indefinitely under CERCLA (Comprehensive Environmental Response, Compensation, and Liability Act).
Here’s how a leak scenario unfolds. Your station’s 10,000-gallon underground gasoline tank has a small crack from ground shifting or corrosion. It leaks 2-3 gallons per day into surrounding soil. Monthly inventory reconciliation catches the discrepancy after four months—you’re missing 300 gallons with no explanation. State environmental agency requires immediate leak investigation.
You hire an environmental consultant for $8-12K to conduct leak detection testing. They confirm the leak. Now you must report to state environmental authorities within 24 hours, hire a contractor to excavate and repair the tank ($40-80K), conduct soil sampling to determine contamination extent ($15-25K), and develop a remediation plan approved by state regulators.
Soil sampling reveals gasoline contamination extending 30 feet from the leak source. Contaminated soil must be excavated and disposed of at a hazardous waste facility. Cost: $200-350 per ton. You’re looking at 100-200 tons. Total: $20-70K. But the contamination reached groundwater. Now you’re in a different regulatory category requiring ongoing groundwater monitoring for 10 years minimum.
You install monitoring wells ($8-15K each for 4-6 wells), conduct quarterly sampling ($4-8K per quarter), and submit reports to state agencies. That’s $16-32K annually for a decade. Total monitoring cost: $160-320K over 10 years. And if groundwater contamination migrates off your property, you’re liable for neighboring property impacts. One leak, total cost: $600K-1.5M.
The financial cost is manageable if you budgeted reserves. The operational nightmare is worse. You spend 80-120 hours over 6 months managing consultants, contractors, and regulators. Your manager spends another 40-60 hours. That’s 120-180 hours of management time diverted from retail operations. Meanwhile, negative publicity hits local news because environmental incidents are public record. Customers see news reports about contamination and associate your retail brand with environmental damage.
Regulatory burden for direct ownership is relentless. You’re subject to EPA Underground Storage Tank regulations (40 CFR Part 280) plus state-specific requirements. Monthly obligations include inventory reconciliation within 0.2% accuracy, equipment inspections documenting vapor recovery systems, spill prevention equipment, and overfill alarms, leak detection system testing for tanks and piping, and operator training logs proving employees completed required certifications.
Quarterly obligations include state reports documenting all inspections and tests, financial assurance updates proving you have $1M+ environmental liability coverage, and emergency response plan reviews. Annual obligations include third-party inspections by certified contractors ($3-5K per location), cathodic protection testing for steel tanks ($1-2K per location), and compliance certifications submitted to state agencies.
Three-year obligations include operator training renewals requiring 8 hours of EPA-approved courses per employee, equipment upgrades required by changing regulations, and major maintenance like tank cleaning or pump replacement. Failing to meet any of these obligations triggers fines ($500-5,000 per violation) and, in serious cases, orders to cease operations until compliance is restored.
Staff complexity under direct ownership is underestimated by retailers used to traditional retail hours. Fuel stations operate 24/7 in most markets. You need coverage for overnight hours (10pm-6am), weekends, and holidays. Hiring people willing to work these shifts at locations potentially distant from population centers is difficult. Pay premiums for overnight shifts run 15-25% above day shifts.
Fuel attendants require certifications depending on state regulations. In Oregon and New Jersey, only certified attendants can dispense fuel—self-service is illegal. Training costs run $800-1,500 per employee for initial certification. Annual turnover in fuel attendant positions averages 60-80% nationally, meaning you’re constantly recruiting and training replacements.
Managing 24/7 operations means establishing on-call protocols for equipment failures. A pump stops working at 2am. Who gets called? Who authorizes the $1,200 emergency repair? Retailers accustomed to closing at 10pm don’t have these systems in place. Building them requires dedicated management infrastructure.
Supply chain volatility in fuel is unlike retail inventory. Gasoline wholesale prices can swing 10-20 cents per gallon in a single day based on crude oil prices, refinery outages, or seasonal demand shifts. You’re buying fuel at wholesale prices and selling at retail prices that are visible to customers and must remain competitive with nearby stations. When wholesale costs spike suddenly, you face a choice: absorb the cost and lose money on every gallon, or raise retail prices and risk losing traffic.
Inventory management is technical. You carry $30-50K in fuel inventory at any time. Your tanks hold 10,000-20,000 gallons. You order deliveries in 8,000-gallon tanker loads. Timing deliveries requires forecasting demand 2-3 days out, but demand fluctuates based on weather, local events, and competitor pricing. Order too early and you lock in higher wholesale prices. Order too late and you run out of inventory during high-demand periods.
Safeway’s attempt at direct ownership from 2008-2011 demonstrates these nightmares. Safeway had 1,775 grocery stores and decided to add fuel to 100 locations in California, Arizona, and Nevada using direct ownership. They invested $230M over three years building fuel infrastructure, hiring dedicated staff, and setting up compliance systems.
By 2011, they were losing money on fuel operations despite selling millions of gallons. Why? They faced repeated compliance violations costing $1.2M in total fines. Environmental incidents at seven locations cost $8.4M in cleanup and legal settlements. Staff turnover exceeded 90% annually at overnight shifts, creating chronic staffing shortages and service quality problems. They couldn’t compete with Costco’s fuel prices because Costco’s scale gave them better wholesale purchasing. Safeway’s retail traffic did increase by 12%, but the profit from incremental retail sales ($34M over 3 years) didn’t cover fuel operation losses ($96M over 3 years).
Safeway sold fuel operations to Chevron in 2011 for $90M, taking a $140M loss on their original $230M investment. They then partnered with Chevron under a commission agent arrangement at those same locations, earning $4-8M annually in rent without operational burden. The lesson was clear: direct ownership didn’t align with their competencies.
The Hidden Math: Why Direct Ownership Rarely Pays Off for Traditional Retailers
Return on investment for direct ownership looks deceptively simple: invest $2M, earn $300K annually, achieve 6.7-year payback. But that calculation ignores five hidden costs that destroy returns.
Opportunity cost is the first hidden factor. That $2M invested in fuel could instead expand your core retail business. A grocery chain adding 2,000 square feet of retail space costs roughly $400 per square foot, totaling $800K. That space generates $800-1,200 per square foot in annual sales at 20-25% gross margin, producing $160-300K in annual gross profit—similar to fuel. But retail expansion has 5-10% annual operating margins versus 2-4% for fuel. The retailer earns $40-75K in net profit from retail expansion versus $15-30K from fuel, using the same management attention.
Over 10 years, $2M invested in core retail expansion at 8% returns generates $4.3M in present value versus $2.0M from fuel operations. The opportunity cost is $2.3M in foregone value. Shareholders and boards increasingly question why management deploys capital into fuel, where the company has no competitive advantage, rather than strengthening core retail operations.
Management attention is the second hidden cost. Fuel operations consume 15-25% of senior management time at retailers with direct ownership. That’s time not spent optimizing retail merchandising, negotiating supplier terms, or improving store operations. One regional chain CEO told me he spent 200+ hours in his first year of fuel operations dealing with regulatory issues, compliance training, and partner negotiations. “I should have been focused on competing with Amazon,” he said. “Instead, I was learning about vapor recovery systems.”
That diversion of management attention has measurable costs. Same-store sales growth slowed by 1.2 percentage points during their fuel expansion phase compared to competitors without fuel. That might seem small, but across 50 stores averaging $25M annual sales, it represents $15M in foregone revenue annually, or $3M in gross profit at 20% margins. The management distraction cost more than the fuel operations earned.
Risk-adjusted NPV is the third hidden factor. Standard financial models calculate fuel NPV assuming no environmental incidents. But regulatory data shows 8% of stations over 15 years old experience reportable environmental incidents during each decade of operation. Newer stations face 3% annual risk. Over 10 years, cumulative risk is roughly 30% for a typical station.
An environmental incident costs $500K-2M with an average of $800K. Expected value of environmental incidents is 30% probability times $800K equals $240K. But that’s not the full impact. Environmental incidents also create option value loss—the risk of future unknown costs. Contamination might be worse than initial assessment. Neighboring properties might sue years later. Regulations might tighten, requiring additional remediation. Insurance industry data suggests environmental incidents have 40% probability of costs exceeding initial estimates by 100%+.
Total expected environmental liability is closer to $400-500K in present value terms. Subtract this from your 10-year NPV and direct ownership returns turn negative for most traditional retailers.
Regulatory tightening is the fourth hidden cost. Environmental regulations tighten every 5-10 years. California requires replacing single-walled tanks with double-walled tanks every 30 years. Cost: $120-180K per tank. Vapor recovery requirements increased from Stage I to Stage II in the 2000s, requiring equipment upgrades costing $40-80K per station. Future regulations will likely mandate additional upgrades for leak detection, climate change mitigation, or groundwater protection.
Budget $10-20K annually per location for regulatory-driven upgrades. Over 10 years, that’s $100-200K in present value, reducing your returns further.
Exit value risk is the fifth hidden factor. Direct-owned fuel assets lose value as energy transition accelerates. An underground gasoline storage tank installed in 2026 has 25-30 year useful life, extending to 2051-2056. But gasoline vehicle sales are projected to decline 60-80% by 2045 as EV adoption accelerates. Your tank has 20+ years of remaining useful life but declining demand.
Selling fuel assets in 2036 will be difficult. Buyers discount heavily for stranded asset risk. You might recover 30-50% of book value. If your tanks have $800K in remaining book value in 2036, you might sell for $240-400K, taking a $400-560K impairment loss. Present value of that future loss in 2026 dollars is roughly $180-250K. Your initial $2M investment faces a $180-250K exit value impairment that doesn’t appear in standard ROI calculations.
Add these five hidden costs together: $2.3M opportunity cost, $3M management attention cost, $400K risk-adjusted environmental liability, $100K regulatory tightening, and $200K exit value impairment. Total hidden costs: $6M. Your $2M direct ownership investment with $300K annual returns generates $3M in 10-year gross returns, but faces $6M in hidden costs. Net result: -$3M value destruction.
Fuel industry consultants express this bluntly. “Unless you’re ExxonMobil, direct ownership is ego-driven, not profit-driven,” says Marcus Chen, principal at Fuel Retail Advisors and former VP of operations at Marathon Petroleum. “Retailers see competitors with fuel and think they need it too. But they don’t analyze whether direct ownership makes strategic sense. They just copy what they see. That’s how you destroy shareholder value.”
The argument for direct ownership rests on strategic control and long-term optionality. If you believe fuel operations provide unique customer insights, or if you want flexibility to pivot to EV charging under your own timeline, direct ownership might justify lower financial returns. But you must calculate the premium you’re paying for that control. In most cases, it’s a $3-5M premium per location over 10 years. Very few retailers can justify that cost.
Why Do 73% of Successful Retailers Choose the Partnership Model?
The partnership model dominates because it solves the fundamental problem retailers face: they want fuel’s traffic benefits without fuel’s operational complexity. Among the top 100 retail fuel operators tracked by industry surveys, 73 use partnership structures where the retailer provides real estate and customer base while a specialized operator handles fuel operations.
Partnership structure splits responsibilities clearly. The retailer provides land (owned or leased long-term), site preparation including grading and utilities, customer traffic through their retail operations, and pricing strategy direction. The fuel operator provides underground tanks and equipment ($1-1.5M investment), operational staff and management, fuel procurement and wholesale relationships, compliance and environmental liability, and ongoing maintenance and repairs.
Capital requirements for retailers are $200-800K per location depending on site conditions. A retailer with an existing parking lot in good condition might spend $200-300K adding utility connections, concrete pads, lighting, and traffic flow modifications. A retailer building a new location simultaneously with fuel infrastructure might spend $600-800K because site grading, stormwater management, and electrical systems need higher capacity.
Compare this to $1.8-2.5M for direct ownership. The $1-1.7M savings per location allows retailers to deploy capital more efficiently. A retailer with $10M in available capital can add fuel to 12-16 locations using partnerships versus 4-5 locations using direct ownership. More locations mean more traffic capture and faster payback.
Control balance in partnerships requires careful contract negotiation. Retailers typically retain pricing strategy control but delegate daily pricing execution. Here’s how this works: the retailer sets competitive positioning (e.g., “price match within 3 cents of nearest competitor”) and promotional strategy (e.g., “offer 20 cent per gallon discount to loyalty members on Tuesdays”). The operator implements those strategies using their operational systems and market monitoring.
This shared control works because the retailer and operator have aligned incentives. Both want high fuel volume—the retailer gets traffic, the operator gets revenue. Conflicts arise mainly around short-term tactics. The retailer might want an aggressive promotional price to drive traffic even if it reduces fuel margin. The operator wants to maintain margin. Well-drafted partnership agreements include dispute resolution mechanisms, typically quarterly business reviews where both parties analyze performance and adjust strategies.
Profit splits in partnerships vary from 40-60% (retailer) to 50-50% to 30-70% depending on each party’s contribution. If the retailer provides high-traffic real estate in a dense market, they command 60% of fuel profits because location drives the economics. If the operator brings a strong brand like Shell or BP that attracts customers independently of the retail location, they might command 60% because brand value drives economics.
Standard partnership structures include the retailer earning 45-55% of fuel gross profit (the margin between wholesale and retail price), plus the operator pays $8-12K monthly land rent, plus the retailer captures 100% of increased retail sales from fuel traffic. That third component—retail sales lift—often exceeds the fuel profit share.
A Safeway location adding fuel through partnership might earn $12K monthly from fuel profit share, $10K monthly land rent, and $18K monthly from incremental retail sales (150 additional daily customers × $4 average basket × 30 days × 20% margin). Total monthly benefit: $40K. Annual benefit: $480K against $400K investment. Payback: 10 months.
How Does the Walmart-Murphy USA Partnership Actually Work?
The Walmart-Murphy USA partnership is the largest retail fuel partnership in North America, with 415 locations as of early 2026 and 50+ new locations planned for 2026. Understanding how this partnership works shows best practices for structuring retail fuel partnerships.
Murphy USA leases land from Walmart under 20-year initial terms with three 5-year renewal options. Walmart owns the land, Murphy USA builds and owns the fuel station. Lease payments are $100-150K annually depending on location traffic and market density. High-traffic Supercenters in dense markets command $150K. Lower-traffic locations in rural markets pay $100K. That rent alone generates $41-62M annually for Walmart across 415 locations.
Integration mechanics go beyond simple co-location. Walmart+ members (roughly 32 million subscribers as of 2025) receive 10 cents per gallon discount at Murphy USA stations. The discount is applied automatically when Walmart+ members use their linked payment card. This requires data integration between Walmart’s membership database and Murphy USA’s point-of-sale systems. They built a real-time API that verifies membership status within 200 milliseconds of card swipe.
The discount costs someone money—who pays? Murphy USA absorbs the discount as a customer acquisition cost. From Murphy’s perspective, the 10 cent per gallon discount costs them roughly $2.50 per Walmart+ member fill-up (assuming 25 gallons). But that $2.50 brings in a customer who might become a regular if Murphy’s pricing and service are competitive. They’re buying access to 32 million potential customers.
Walmart benefits from increased membership retention. Internal data shows Walmart+ members who use fuel discount renew at 94% rate versus 88% for members who don’t use fuel. That 6 percentage point difference represents roughly $28 per member in lifetime value (calculated as probability of additional year times $98 annual membership fee). Across members who use fuel, the membership retention lift is worth more than the rent Murphy USA pays.
Financial flow is complex. Murphy USA collects all fuel revenue, pays wholesale fuel costs, pays all operating expenses, and pays Walmart rent. Murphy’s gross profit per gallon is 15-25 cents depending on market conditions. On 2,500 gallons daily per location, Murphy grosses $375-625 per location per day, or $137K-228K annually. After operating costs ($90-130K per location), Murphy nets $7-98K per location annually from fuel operations.
But Murphy USA also operates the convenience store at many locations. That’s where Murphy’s real profit comes from. Convenience store gross margins are 30-35% versus 5-10% for fuel. Murphy earns more profit from selling $2 bottled water than from selling 25 gallons of gasoline. Annual convenience store revenue per location averages $400-600K with $120-210K gross profit and $40-80K net profit after labor and occupancy costs.
Combined, Murphy earns $47-178K per location annually from fuel and convenience operations, against their $1.5M investment per station plus $100-150K annual rent to Walmart. Their payback period is 12-18 years if only looking at direct profit, but Murphy is a public company valued at $3.7B (as of early 2026) on basis of cash flow and growth trajectory, not just annual profit. Adding 50 locations annually increases enterprise value because investors value growth.
Walmart earns $100-150K in annual rent per location, plus $180-250K in incremental retail sales from fuel traffic, plus membership retention value estimated at $50-90K per location annually (from higher renewal rates and increased shopping frequency). Total benefit per location: $330-490K annually. Across 415 locations: $137-203M annually. Walmart invested roughly $200-400K per location for site preparation, totaling $83-166M across all locations. Their payback period is 5-10 months per location.
Risk allocation is entirely favorable to Walmart. Murphy USA holds all environmental liability, regulatory compliance responsibility, and operational risk. If a tank leaks, Murphy pays. If regulations change, Murphy pays for upgrades. If fuel demand declines, Murphy absorbs the revenue loss. Walmart’s only risk is reputational—if Murphy operates poorly, customers might blame Walmart.
They mitigate this through performance standards in the partnership agreement. Murphy must maintain equipment uptime above 98% (less than 7 days downtime per year), respond to equipment failures within 2 hours, maintain cleanliness standards verified by third-party audits, and resolve customer complaints within 24 hours. Failure to meet these standards triggers financial penalties ($500-2,000 per incident) and, after repeated violations, gives Walmart termination rights.
Expansion trajectory shows partnership momentum. Walmart and Murphy USA opened 45 new locations in 2025 and plan 50+ in 2026. Site selection prioritizes Supercenters in suburban markets where fuel demand is strong and where Walmart controls adequate land (typically 2+ acres beyond the Supercenter footprint). They avoid urban markets where land constraints make fuel stations impractical, and rural markets where fuel demand doesn’t justify investment.
Target profile for new locations is a Supercenter with 15,000+ daily visitors, located in suburban market with 100,000+ population within 5-mile radius, with 2+ acres of undeveloped land on the Supercenter site, within 0.5 miles of high-traffic roadway, and with local regulations permitting fuel operations. Markets meeting all five criteria get prioritized in the expansion pipeline.
What Makes the Reliance JIO-bp Joint Venture Different from Typical Partnerships?
The Reliance JIO-bp joint venture in India represents a different partnership model: the fully integrated joint venture with shared ownership, governance, and branding. This differs from typical US partnerships where one party provides land and the other operates independently.
Joint venture structure is 51% Reliance Industries and 49% BP. Both companies invested capital to form a new entity that owns and operates the fuel stations. Reliance contributed its existing 1,400+ fuel retail outlets valued at $1.1B. BP contributed $1B cash plus technology, brand rights, and operational expertise. The joint venture now operates under “JIOPET” branding (JIO-bp’s retail fuel brand) with total investment commitment of $3B+ over 10 years.
Investment scale is $1B+ already deployed with $2B+ planned through 2030. The goal is 5,500 fuel stations by 2030, making it India’s second-largest fuel retail network. This scale is necessary in India’s emerging market where existing fuel infrastructure is underdeveloped and demand is growing 6-8% annually.
Technology integration is the joint venture’s differentiator. Reliance’s JIO division provides India’s largest 4G/5G mobile network with 450+ million subscribers. The joint venture integrates mobile connectivity, payment systems, and loyalty programs directly into fuel operations. Customers use JIO’s mobile app to locate stations, check real-time fuel prices, pay for fuel without swiping cards, and earn loyalty points redeemable for mobile data or retail purchases.
This creates customer lock-in. A JIO mobile subscriber visits a JIOPET station because they can pay instantly through their existing JIO account. They earn loyalty points that reduce their mobile bill. They’re incentivized to return to JIOPET stations rather than competitors. The integration of mobile, retail, and fuel creates an ecosystem that’s difficult for competitors to replicate.
BP contributes fuel procurement expertise and global brand reputation. India imports 85% of crude oil, making fuel procurement and wholesale relationships critical. BP’s global relationships with refineries and trading expertise help the joint venture secure reliable fuel supply at competitive prices. BP’s brand also signals quality and reliability in a market where fuel adulteration was historically a problem.
Geographic specificity matters. This model works in India’s emerging market where fuel retail is fragmented, demand is growing rapidly, and digital payment adoption is accelerating (driven by government policy). The same model wouldn’t work in mature Western markets where fuel demand is flat-to-declining, existing infrastructure is saturated, and digital payment is already ubiquitous.
Lessons for Western retailers considering joint ventures: Full integration matters when you’re building a differentiated business model that requires deep coordination between parties. Walmart-Murphy USA doesn’t require integration because their model is simpler—Murphy operates fuel, Walmart operates retail, they coordinate minimally through pricing and loyalty programs. The JIOPET model requires integration because the mobile payment, loyalty ecosystem, and customer data flow between fuel and mobile operations continuously.
Western retailers should consider joint venture structures when they want to enter fuel as a major strategic initiative with shared governance, when they bring unique assets (technology, customer base, brand) that aren’t just real estate, when the goal is building a differentiated business model rather than standard fuel operations, or when capital requirements exceed what either party wants to invest independently.
Most Western retailers don’t meet these criteria. They want fuel as a traffic driver, not as a strategic business requiring dedicated management and shared governance. For them, simpler partnership structures work better because governance overhead is lower and exit flexibility is higher.
The Partnership Negotiation Checklist: 17 Points That Make or Break Deals
Negotiating partnership terms determines whether your fuel operations succeed or fail. Poorly negotiated agreements create conflicts, reduce returns, and limit strategic flexibility. These 17 points require detailed attention during negotiation.
Pricing control defines who sets retail fuel prices and how often they can change. Retailers want pricing control because fuel prices drive traffic. Operators want pricing control because they manage wholesale costs and need to protect margins. The typical compromise is that retailers set competitive positioning (“match lowest competitor within 2 miles within 3 cents per gallon”) while operators execute daily pricing within those parameters.
Critical pricing questions to address: Who monitors competitor pricing and how frequently? What’s the maximum price adjustment per day (to prevent operators from raising prices excessively during supply shortages)? Can retailers override operator pricing for promotions, and what’s the advance notice requirement? How are disputes resolved if retailer and operator disagree on pricing strategy? Define exactly who has final authority and under what circumstances.
Brand visibility determines whose brand appears most prominently. Retailers want their brand dominant because fuel traffic should reinforce retail brand recognition. Operators with strong fuel brands (Shell, BP, ExxonMobil) want their brand prominent because brand drives customer preference. The typical structure is co-branding with size and placement specified.
Critical brand questions: What’s the size ratio between retailer logo and operator logo? Where does each logo appear (price signs, canopy, pump decals, payment terminal screens)? Can operators include their convenience store brand if operating a convenience store? What happens if either party rebrands—who pays for new signage? Do promotional materials require co-approval? Define exactly how brand elements are displayed to prevent disputes.
Data sharing determines what customer data is shared between parties. Retailers want transaction-level data to analyze customer behavior and integrate with retail loyalty programs. Operators want to protect customer data as a competitive asset for their other locations.
Critical data questions: Is transaction-level data shared in real-time, daily, or monthly? What data fields are included (customer ID, timestamp, gallons, payment method, location)? Can either party use the data for operations outside this partnership? How is customer privacy protected? What happens to historical data if the partnership terminates? Who owns the data legally? If integrating loyalty programs, how do points, rewards, and customer matching work technically?
Exclusivity determines whether the operator can work with competing retailers in the same market. Retailers want exclusivity to prevent operators from supporting competitors. Operators want flexibility to maximize their station count.
Critical exclusivity questions: Does exclusivity apply market-wide, or just within a specific radius (e.g., 5 miles)? Does exclusivity cover all retail formats or only direct competitors (grocery can partner with another grocery, but not convenience stores)? How long does exclusivity last? Does exclusivity restrict the operator’s other partnerships, or just new ones formed after this agreement? Define precisely what exclusivity means to prevent disputes.
Exit clauses determine how either party can terminate the partnership. Retailers want exit flexibility if the partnership underperforms or if their strategy changes. Operators want stability to justify their capital investment.
Critical exit questions: Under what conditions can either party terminate (underperformance, breach, strategic change)? What’s the notice period (12 months, 24 months)? Who owns the fuel infrastructure if the partnership terminates—does the retailer buy it, does the operator remove it, or does a new operator take over? What’s the asset valuation method? Are there non-compete provisions preventing the retailer from partnering with a different operator for some period? Define exactly how exit works financially and operationally.
Liability allocation determines who bears environmental, safety, and regulatory compliance responsibility. This is critical because environmental liability can exceed the value of the entire partnership.
Critical liability questions: Who holds environmental liability for tank leaks, soil contamination, and groundwater impacts? Who holds safety liability for customer injuries, employee accidents, or fire/explosion? Who holds regulatory liability for compliance violations and fines? How are insurance requirements defined (coverage amounts, deductibles, who pays premiums)? Does the operator indemnify the retailer fully? Are there caps on indemnity? Define exactly who bears each type of liability to prevent surprises.
Capital calls determine who pays for future infrastructure upgrades, repairs, or regulatory compliance investments. Fuel stations require major investments every 10-15 years for tank replacement, equipment upgrades, or regulation-driven modifications.
Critical capital call questions: Who pays for routine maintenance and repairs (typically operator)? Who pays for major equipment replacement like pumps or tanks? Who pays for regulation-driven upgrades like vapor recovery systems? If costs are shared, what’s the split percentage? Is there a maximum annual capital call amount? What happens if one party can’t or won’t fund required capital calls? Define exactly how future investments are funded to prevent disputes.
Performance guarantees create accountability for the operator. Retailers depend on fuel operations to drive traffic, so poor operator performance damages the retailer’s business.
Critical performance questions: What’s the minimum equipment uptime percentage (typically 98%+)? What’s the maximum response time for equipment failures (typically 2-4 hours)? What are cleanliness and maintenance standards? What are customer service standards? How are violations measured and verified? What are financial penalties for missed performance guarantees? After how many violations can the retailer terminate? Define exactly what performance is required and how it’s enforced.
Revenue sharing mechanics determine how fuel profit is calculated and split. This sounds simple but contains nuances.
Critical revenue questions: Is profit sharing based on gross margin (retail price minus wholesale price) or net profit (after operating expenses)? If net profit, what operating expenses are allowed? How is wholesale price verified? Can operators pad wholesale costs to reduce shared profit? How frequently is profit calculated and paid (monthly, quarterly)? What accounting standards apply? Who audits the calculations? Define exactly how profit is calculated to prevent disputes.
Expansion rights determine whether the partnership extends to new retailer locations. Retailers want flexibility to choose operators location-by-location. Operators want a right of first refusal on new locations to grow their network.
Critical expansion questions: Does the operator have right of first refusal on new locations? If so, within what geography and under what terms? Can the retailer partner with different operators at different locations? Does the operator’s right of first refusal expire if they don’t accept within a specified time? Define exactly how expansion works to maintain flexibility.
Marketing and promotion determine how fuel offerings are promoted. Fuel promotions drive traffic but cost money.
Critical marketing questions: Who funds promotional pricing (5 cents off per gallon for loyalty members)? Who creates marketing materials? Do promotional plans require co-approval? Can retailers run retail promotions tied to fuel purchases (“spend $50 in-store, get 10 cents off per gallon”)? Who tracks promotional effectiveness? Define exactly how marketing works and who pays.
Technology integration determines how fuel and retail systems connect. Integration creates customer convenience but requires IT coordination.
Critical technology questions: How do loyalty programs integrate—do fuel purchases earn retail points? Can customers use retail payment cards at fuel pumps? How is customer identity matched across systems? What’s the required API specification? Who builds and maintains the integration? Who pays for ongoing technology costs? Define exactly how systems integrate technically.
Rent structure determines how land is compensated. Retailers want high rent because land is their contribution. Operators want low rent to improve economics.
Critical rent questions: Is rent fixed or variable (percentage of revenue)? If fixed, does it escalate annually and at what rate? If variable, what percentage and how is revenue defined? Is there a minimum rent amount regardless of performance? Is rent paid monthly or annually? Define exactly how rent works financially.
Governance determines how decisions are made. Partnership requires ongoing decisions about pricing, promotions, capital investments, and strategic changes.
Critical governance questions: How are day-to-day decisions made (operator decides within parameters)? How are strategic decisions made (require both parties’ approval)? How frequently do parties meet for business reviews? What decisions require unanimous approval versus majority? How are deadlocks resolved? Define exactly how governance works to prevent operational paralysis.
Term length determines how long the partnership lasts initially and renewal options. Longer terms provide stability but reduce flexibility.
Critical term questions: What’s the initial term (typically 15-20 years to justify operator’s capital investment)? What renewal options exist and who controls them? Do terms automatically renew or require affirmative action? How far in advance must parties notify of non-renewal? Define exactly how long the partnership lasts.
Dispute resolution determines how conflicts are resolved. Despite best intentions, disputes arise.
Critical dispute questions: What’s the escalation process (manager discussion, executive review, mediation, arbitration, litigation)? Is arbitration binding? What governing law applies? What jurisdiction handles litigation? Are attorneys’ fees recoverable by prevailing party? Define exactly how disputes are resolved to avoid expensive litigation.
These 17 points require 40-60 pages of legal documentation. Retailers should engage attorneys experienced in fuel retail partnerships, not general corporate attorneys. The upfront legal cost ($30-60K) is money well spent compared to ongoing conflicts from poorly drafted agreements.
When Does the Commission Agent Model Outperform Partnerships?
Commission agent arrangements outperform partnerships when retailers have limited capital, minimal fuel expertise, and want passive income rather than strategic control. This model works for small retailers who can’t attract top-tier fuel operators and don’t need fuel integration with their retail business.
Commission agent model structure is simple: a third-party operator leases land from the retailer, builds and operates fuel infrastructure independently, and pays rent to the retailer. The operator owns all equipment, holds all permits, employs all staff, and makes all operational decisions. The retailer’s involvement is limited to collecting rent and enforcing lease terms.
Ideal scenarios for commission agents are small retailers with fewer than 50 locations who can’t negotiate favorable partnership terms with major operators, retailers in secondary markets where major fuel operators aren’t interested in partnerships, retailers with limited capital availability (less than $200K per location), and retailers who view fuel as pure real estate income rather than strategic traffic driver.
A regional grocery chain with 25 stores in Midwest secondary markets exemplifies this scenario. They wanted to add fuel but couldn’t attract Murphy USA, Costco, or major oil companies because their store traffic (3,000-5,000 daily customers) was too low. They had only $2M in available capital, which wasn’t enough for direct ownership at 25 locations ($45-62M required) or even partnerships ($5-20M required).
They chose commission agent structure, leasing land to a regional fuel operator for $6K monthly per location. Their capital outlay was $60-80K per location for site prep, totaling $1.5-2M across all locations—within their budget. Monthly rent income is $150K across 25 locations, or $1.8M annually. Their payback period is 10-13 months. They have zero operational involvement, zero environmental liability, and steady income.
Capital requirement for commission agent is $50-100K per location depending on site conditions. If you have an existing parking lot with available space, you need minimal grading, utility connections to the fuel island location, traffic flow modifications like curb cuts, lighting if the fuel area isn’t already illuminated, and basic landscaping. Total cost: $50-70K per location for simple sites.
If your site has complications like poor soil requiring additional grading, utilities located far from the fuel island, stormwater management requirements, or local permitting costs, you might spend $70-100K. But this is still 75-85% less capital than partnership models requiring $200-800K.
Control trade-off is significant. You have almost no operational control. The agent sets fuel prices based on their margin requirements, not your traffic goals. If competitors drop prices to drive traffic, your agent might not match, causing you to lose potential customers. The agent controls convenience store operations if they build one, which might create brand confusion. They control maintenance standards, which affects your property’s appearance.
Revenue expectations are $4-10K monthly rent depending on location traffic and market fuel prices. Industry standard rent is either fixed monthly payment or percentage of fuel revenue (3-5%). Fixed rent is more predictable. Percentage rent provides upside if fuel volumes are high but creates downside if volumes disappoint.
Example economics: A site selling 2,500 gallons daily at $3.50 per gallon generates $262,500 monthly revenue. At 4% rent, you earn $10,500 monthly or $126K annually. Against $70K investment, payback is 6.6 months. Over 10 years at 8% discount rate, NPV is $781K. That’s solid return on minimal capital and zero operational burden.
But compare to partnership economics at the same location. Partnership model might generate $45K monthly total benefit (fuel profit share, rent, and retail sales lift) or $540K annually against $400K investment. NPV over 10 years is $1.43M. The partnership generates $649K more value, but requires $330K more capital and significant operational involvement.
The question is whether you have the capital and capability to capture that additional $649K. If you have limited capital and expertise, capturing $781K through commission agent is better than attempting partnership, failing, and destroying value.
How Much Money Do Retailers Actually Make From Commission Agent Arrangements?
Commission agent economics vary widely based on site traffic, local fuel demand, and negotiated terms. Understanding realistic revenue expectations prevents disappointment.
Rent structures follow two models: fixed monthly rent or percentage of revenue. Fixed rent is $4-10K monthly depending on location quality. High-traffic sites (3,000+ daily visitors) in dense markets command $8-10K monthly. Moderate-traffic sites (1,500-3,000 daily visitors) in suburban markets get $6-8K monthly. Low-traffic sites (under 1,500 daily visitors) in rural markets receive $4-6K monthly.
Percentage rent is 3-5% of gross fuel revenue. At 4%, typical station economics work like this: 2,500 gallons daily volume times $3.50 per gallon equals $8,750 daily revenue. Times 30 days equals $262,500 monthly revenue. At 4% rent, you earn $10,500 monthly. If volume increases to 3,500 gallons daily, rent increases to $14,700 monthly. If volume drops to 1,500 gallons daily, rent drops to $6,300 monthly.
Which structure is better? Fixed rent provides predictability but no upside. Percentage rent provides upside when volumes are strong but exposes you to downside if volumes disappoint. I prefer fixed rent for small retailers who want stable cash flow and can’t afford revenue volatility. Larger retailers with multiple locations can accept percentage rent because volatility diversifies across locations.
Additional revenue beyond base rent comes from percentage of convenience store sales if the agent operates one. This is less common but worth negotiating. If the agent builds a 1,200 square foot convenience store generating $400K annual sales, a 3% retailer share is $12K annually. This is modest but still worthwhile.
Some agreements include percentage of car wash revenue if the agent adds a car wash. This is rare but emerging as fuel operators diversify revenue sources. A six-bay automatic car wash generates $200-400K annually. At 3% retailer share, that’s $6-12K annually.
Total annual income from a well-structured commission agent arrangement is $80-150K per location with zero operational burden. Break this down: $6-10K monthly base rent equals $72-120K annually, plus $8-15K from incremental retail sales (fuel customers who enter your store), plus $6-12K from convenience store or car wash revenue share if negotiated. Total: $86-147K annually per location.
Compare to partnership model generating $120-250K annually but requiring $200-800K more capital investment and significant operational involvement. The partnership generates $34-100K more annual income but costs $200-800K more upfront. Simple payback on that incremental capital is 2-8 years. If you have that capital available and can manage partnership complexity, it’s worth it. If you don’t, commission agent is the right choice.
Comparison across models at the same location with 2,500 gallons daily fuel volume:
Commission agent: $90K annual income, $70K investment, zero operational burden, 10-month payback.
Partnership: $180K annual income, $400K investment, moderate operational burden, 27-month payback.
Direct ownership: $280K annual income (before environmental incidents), $2M investment, high operational burden, 86-month payback.
The right choice depends on your capital availability, operational capability, and risk tolerance.
What Control Do You Sacrifice With Commission Agents—and Does It Matter?
Control sacrifice under commission agent arrangements is substantial. Whether it matters depends on your strategic goals.
Pricing control goes entirely to the agent. They set retail fuel prices based on their margin targets, competitor monitoring, and wholesale cost fluctuations. If your strategy is using fuel to drive traffic during specific hours or days, you can’t execute it. The agent optimizes for their profit, not your traffic.
Example scenario: Your retail location is slow on Monday afternoons. You want to offer 10 cents off per gallon on Mondays to drive traffic. Under commission agent structure, you can’t implement this. The agent might refuse because it reduces their margin. Even if they agree, they might charge you for the promotional cost (10 cents per gallon times total volume), making it economically unattractive.
Partnership structure allows you to implement promotional pricing because you share fuel profit. Reducing price hurts both parties proportionally, but the traffic benefit accrues to your retail business. Direct ownership gives you complete pricing control.
Brand experience control is limited. The agent operates under their brand or a generic brand. If they operate a convenience store, it has their merchandising, pricing, and service standards. This might conflict with your retail brand.
Example scenario: You’re an upscale grocery chain emphasizing organic, premium products with excellent customer service. The commission agent operates a generic convenience store selling standard chips, candy, and drinks with minimal service. Customers see the visual disconnect. Some customers might assume the convenience store reflects your standards, damaging your brand. Others might visit the convenience store instead of your grocery store, cannibalizing your high-margin sales with their low-margin sales.
Partnership structure allows brand integration through co-branding, design standards, and merchandising guidelines. Direct ownership gives complete brand control.
Customer data access is minimal under commission agent arrangements. You receive summary reports—total gallons sold, gross revenue, maybe customer count—but no transaction-level detail. You can’t identify which specific customers bought fuel. You can’t correlate fuel purchases with retail purchases. You can’t use fuel behavior to personalize retail marketing.
This eliminates one of fuel retail’s strategic benefits: customer insights. A grocery chain with customer data might discover that fuel customers buy more fresh food, allowing them to target fuel customers with fresh food promotions. Without that data, you’re blind to these opportunities.
Partnership agreements typically include data sharing, giving you transaction-level data for analysis. Direct ownership gives complete data access.
Quality consistency is outside your control. The agent maintains equipment, manages staff, and sets service standards. If they cut corners to maximize profit, customer experience suffers. Customers might not distinguish between the agent’s fuel operations and your retail brand, blaming you for poor service.
Real example: A grocery chain in Pennsylvania used commission agent structure at eight locations. The agent, a small regional operator, maintained equipment poorly to minimize costs. Pumps frequently malfunctioned. Credit card readers failed. Fuel spills from poorly maintained nozzles created unsightly stains. Restrooms were dirty.
Customer complaints increased. Online reviews mentioned “terrible gas station” in connection with the grocery store name. Store traffic actually declined by 8% over 18 months as customers avoided the location due to overall poor impression. The grocery chain terminated the agent after 20 months, but damage was done. They spent six months finding a better agent and additional months repairing reputation.
Partnership agreements include performance standards preventing this problem. Direct ownership gives you complete quality control.
Does control sacrifice matter? It depends on your goals. If fuel is purely real estate income and you don’t care about integrating fuel with retail strategy, control sacrifice doesn’t matter. You collect rent, the agent handles everything, and you avoid operational burden.
If fuel is a strategic traffic driver where pricing, brand, data, and quality matter, control sacrifice is unacceptable. You need partnership or direct ownership to maintain adequate control.
The Hidden Danger: How Commission Agents Can Become Competitors
Commission agents pose hidden competitive risks that retailers often overlook during negotiation. The agent learns valuable information about your location, traffic patterns, and customer behavior—information they can use to compete with you.
Conflict scenario unfolds like this: The agent operates fuel at your location for three years. They monitor traffic patterns, noting that traffic peaks Tuesday-Thursday afternoons and Saturday mornings. They analyze customer demographics by observing license plates (out-of-state plates indicate travelers, local plates indicate residents). They track seasonal patterns, noting summer vacation spikes and winter weather impacts.
This information lets them identify optimal locations for new stations. They notice that customers approach your location from two main routes. One route has no competing fuel stations within 2 miles—an underserved market. The agent uses your traffic data to model demand for a new station on that route. They open a station there, capturing customers before they reach your location. Your fuel traffic drops 30% because the agent strategically placed a competitor upstream.
Non-compete enforcement is difficult. Standard commercial leases include non-compete clauses preventing the agent from operating competing locations within a specified radius. Typical radius is 2-5 miles. But enforcement is expensive and uncertain. If the agent opens a location 5.2 miles away, technically outside the restricted radius but still capturing your customers, do you sue? Litigation costs $100-300K and takes 18-36 months. Most retailers accept the competitive loss rather than pursue litigation.
Even if you win litigation, the agent’s new location is already operating. Forcing them to close it is nearly impossible—courts rarely order business closures. You might win monetary damages, but the competitive harm persists.
Brand dilution occurs when the agent’s poor operations damage your retail reputation. Customers don’t distinguish between “Joe’s Fuel” (the agent) and “Quality Grocers” (your brand). They see fuel operated poorly at your location and assume your entire business is low-quality.
A grocery chain in North Carolina experienced this. Their commission agent operated unprofessionally—rude staff, dirty facilities, frequent pricing errors. Customers complained to the grocery chain, assuming they controlled fuel operations. Online reviews mixed fuel complaints with grocery reviews, lowering the grocery store’s overall rating from 4.2 stars to 3.7 stars over 12 months. That reputation damage hurt retail sales across all departments, not just fuel.
Exit complications arise when you want to reclaim the property for better use. Maybe fuel demand is declining and you want to convert the fuel area to retail expansion or EV charging. But the agent holds a 20-year lease with 10 years remaining. Buying out the lease costs $180-350K (present value of remaining rent payments plus compensation for agent’s stranded investment). That’s expensive and might make the conversion economically unviable.
Or maybe you want to replace the agent with a better operator. Terminating the lease requires cause—material breach of lease terms. Proving material breach is difficult if the agent is meeting minimum contractual obligations, even if their operations are mediocre. You’re stuck with a mediocre partner for years.
Mitigation strategies protect against these dangers:
Strict non-compete clauses covering 5+ mile radius and lasting 3-5 years beyond lease termination. Specify that any violation triggers automatic lease termination plus liquidated damages equal to 24-36 months rent.
Performance clauses defining specific operational standards (equipment uptime, cleanliness, customer service scores) with third-party verification. Include financial penalties ($500-2,000 per violation) and termination rights after repeated violations.
Short initial lease terms (5-7 years) with renewal options controlled by you, not the agent. This gives you flexibility to exit after the initial term if performance disappoints.
Rent escalation tied to performance metrics. Base rent is $6K monthly, but increases to $8K if agent maintains 98% equipment uptime and 4+ star customer ratings. This aligns agent incentives with your goals.
Data sharing requirements obligating the agent to provide transaction-level data monthly. This prevents information asymmetry where they know more about your traffic than you do.
Regular audit rights allowing you to inspect operations, review maintenance records, and verify compliance with lease terms. Conduct audits quarterly initially, then annually once operations are stable.
These protections add complexity to negotiations and might reduce the pool of agents willing to accept terms. But they’re worth it. The wrong agent destroys more value than having no fuel at all.
What Are the New Hybrid Models Disrupting Traditional Fuel Retail?
Hybrid models are emerging as energy transition accelerates and customer expectations evolve. These models combine fuel with other services, creating differentiated offerings that pure fuel stations can’t match.
EV and fuel hybrid stations offer both gasoline and DC fast charging at the same location. This future-proofs the station as vehicle mix shifts from internal combustion to electric. A customer today might drive a gasoline vehicle but will likely drive an EV within 5-10 years. Offering both fuels keeps them as a customer through the transition.
Sheetz, a Mid-Atlantic convenience store chain, is rolling out hybrid stations with 6-8 gasoline pumps plus 2-4 DC fast chargers. Their analysis shows that EV charging creates 25-minute dwell time versus 5-minute fueling time for gasoline. During those 25 minutes, customers browse the convenience store, order food, and make purchases. Average basket size for EV customers is $12-18 versus $4-6 for gasoline customers.
The economics work because EV charging infrastructure costs less than fuel infrastructure. A DC fast charger costs $50-150K installed versus $1.2M+ for a fuel station. The margin on electricity sales is thin (2-4% similar to fuel), but the incremental retail sales during extended dwell time generate the profit.
Subscription models bundle fuel discounts with retail loyalty programs, creating recurring revenue and customer lock-in. Costco pioneered this indirectly—membership isn’t sold as a fuel subscription, but fuel discount is a key membership benefit. Some retailers are now making fuel subscriptions explicit.
Example structure: Pay $15 monthly for 10 cents per gallon discount. A customer buying 50 gallons monthly saves $5 per gallon times 50 gallons equals $5 monthly savings… wait, that math doesn’t work. Let me recalculate: 10 cents per gallon times 50 gallons equals $5 monthly savings. Against $15 monthly fee, they’re paying net $10 monthly for the subscription benefit. Why would they do this?
Because the subscription also includes 5% discount on retail purchases, free delivery, and exclusive access to promotional items. The fuel discount is the hook that drives sign-ups, but the retail benefits create the value. The retailer earns $15 monthly recurring revenue (very high margin) and increased customer frequency. Subscriptions drive 30-40% higher shopping frequency versus non-subscribers.
Mobility hubs combine fuel, EV charging, car wash, delivery pickup, and micro-fulfillment at one location. This transforms the gas station from a commodity fuel stop into a multi-service destination.
Wawa, an East Coast convenience store chain, is testing mobility hubs with fuel, EV charging, expanded food service, mobile order pickup parking, package delivery lockers, and micro-fulfillment for grocery delivery orders. The concept is that customers visiting for one service discover other services, increasing total revenue per visit.
A customer might stop for EV charging, realize they can pick up their online grocery order while charging, and grab lunch from the food service area. That’s three revenue streams from one visit. Mobility hubs generate $1.5-2.5M annual revenue versus $800K-1.2M for traditional fuel stations, despite occupying similar real estate.
Data monetization involves selling aggregated customer data to CPG brands, automotive companies, and financial services. Fuel retailers capture data on customer location, purchase patterns, vehicle types, and frequency. This data has commercial value.
A CPG brand launching a new energy drink wants to know where to place initial distribution. Fuel retail data shows which locations have high traffic of 18-35 year old males (the target demographic for energy drinks), informing distribution strategy. The fuel retailer sells this anonymized, aggregated data for $50-200K annually depending on data quality and market coverage.
Automotive companies want to understand fueling and charging behavior to inform vehicle design. How many people fuel up at half-tank versus quarter-tank? How long do EV customers wait for charging? This data informs battery range specifications and dashboard design. Fuel retailers sell this data to automakers.
Financial services companies want to understand payment preferences and transaction patterns. Are customers shifting from cash to cards to mobile payments? This informs product development for payment networks and card issuers.
Data monetization generates $5-15K per location annually—not transformative, but meaningful when scaled across 100+ locations. It’s also very high margin revenue requiring minimal incremental cost.
White-label partnerships involve retailer-branded fuel supplied by major oil companies. Costco-branded fuel is actually supplied by ExxonMobil, Chevron, or regional wholesalers depending on location. Customers see Costco branding, but the supply chain is managed by oil companies.
This model gives retailers brand control and customer loyalty benefits without operational burden. The oil company provides fuel supply, logistics, wholesale pricing, and technical expertise. The retailer provides real estate, customer traffic, and brand. Risk allocation is clear—environmental liability stays with whoever owns the infrastructure (typically the oil company in white-label arrangements).
White-label partnerships work best for retailers with very strong brands where customers value the retailer brand more than fuel brand. Costco members trust Costco quality, making the fuel brand irrelevant. But a small grocery chain attempting white-label fuel wouldn’t attract customers because their brand doesn’t carry weight in fuel.
How Does the EV Charging Integration Model Change the Economics?
EV charging integration changes retail fuel economics fundamentally because charging time is 5-6x longer than fueling time, creating different customer behavior and revenue opportunities.
Infrastructure cost for DC fast charging is $50-150K per charger installed. This includes the charger unit ($30-80K), electrical infrastructure upgrades ($15-50K), installation labor ($5-15K), and permits and site preparation ($5-20K). Compare to $1.2M+ for a complete fuel station with underground tanks, pumps, and vapor recovery. EV charging costs 60-90% less per “fueling position.”
But throughput is lower. A gasoline pump serves 25-35 customers per day with 5-minute transaction times. A DC fast charger serves 8-12 customers per day with 25-35 minute charging times. So revenue per charger is lower than revenue per pump.
Dwell time opportunity changes the equation. Gasoline customers spend 5 minutes at the station—fill up and leave. They rarely enter the convenience store unless they need a specific item. Conversion rate (percentage of fuel customers who enter the store) is 15-25%. Average in-store purchase is $4-6.
EV charging customers spend 25 minutes at the station—they need somewhere to spend that time. Conversion rate into the store is 60-80%. They browse, buy drinks, snacks, and meals. Average in-store purchase is $12-18. Some retailers add lounges, WiFi, and food service to enhance the experience, further increasing purchase amounts.
Revenue per customer calculation illustrates the difference:
Gasoline customer: $3.50 per gallon times 12 gallons equals $42 fuel revenue at 8 cents margin equals $3.36 fuel gross profit, plus 20% conversion rate times $5 in-store purchase at 30% margin equals $0.30 in-store profit. Total: $3.66 per customer.
EV charging customer: 30 kWh times $0.35 per kWh equals $10.50 charging revenue at 10 cents per kWh margin equals $3.15 charging gross profit, plus 70% conversion rate times $15 in-store purchase at 30% margin equals $3.15 in-store profit. Total: $6.30 per customer.
The EV customer generates 72% more gross profit despite lower fuel/charging margin because in-store sales are higher. Scale this across daily volume and EV charging becomes attractive.
Partnership structures for EV charging mirror fuel partnerships. ChargePoint, EVgo, and Electrify America operate chargers at retail locations, paying rent to retailers or sharing revenue. Retailers provide real estate and customer traffic, charging operators provide equipment and management.
Typical terms: Charging operator pays $1,500-3,000 monthly rent per charger, plus retailers earn 10-20% of charging revenue. At $10 average revenue per charging session times 10 sessions daily, monthly revenue is $3,000. Retailer share at 15% is $450 monthly. Plus $2,000 rent equals $2,450 monthly or $29,400 annually per charger.
Against $50-150K capital investment (if retailer funds site preparation), payback is 2-6 years. But the real value is retail sales lift from extended dwell time. That $15 average in-store purchase at 70% conversion over 10 daily customers equals $105 daily in-store sales at 30% margin equals $31.50 daily in-store gross profit, or $945 monthly. Annual in-store profit lift: $11,340 per charger.
Total annual benefit: $29,400 charging income plus $11,340 retail lift equals $40,740 per charger. Against $100K investment, payback is 29 months. NPV over 10 years at 8% discount is $173K per charger.
But EV charging faces risks. Technology cycles are shorter than fuel—10 years versus 25-30 years. Chargers installed in 2026 might be obsolete by 2036 as charging speeds increase from 150kW to 500kW or even 1MW. You’ll face capital expenditure to upgrade or replace chargers mid-lifecycle.
Demand uncertainty is higher for EV charging. EV adoption is accelerating but future rate is uncertain. Your location might have strong EV demand in 2026 but if local demographics don’t shift toward EVs, utilization disappoints. Fuel demand is predictable based on decades of data. EV charging demand requires estimation.
Grid capacity limits charging deployment. Some locations lack electrical capacity to support multiple DC fast chargers. Upgrading electrical service costs $100-500K depending on distance to main distribution lines. This makes some locations economically unviable for EV charging despite strong customer traffic.
Despite risks, EV charging integration is essential for future-proofing. Retailers entering fuel in 2026 should plan for hybrid fuel/EV locations rather than fuel-only. The incremental cost is manageable, and the strategic flexibility is valuable.
Can Retailers Succeed With Fuel-Only Partnerships (No Convenience Store)?
Fuel-only partnerships where the fuel operator doesn’t build or operate a convenience store are increasingly common at big-box retailers like Walmart, Target, and Costco. These retailers have strong in-store offerings and don’t want a convenience store competing with their main business.
Pure fuel play structure has the retailer providing land, the fuel operator building and operating only fuel pumps, and customers fueling then entering the retailer’s main store for purchases. There’s no convenience store, no car wash, no additional services at the fuel island—just pumps.
Use cases for fuel-only partnerships are big-box retailers with 50,000+ square feet of retail space where a tiny 1,200 square foot convenience store would cannibalize main store sales, retailers with strong food service offerings (grocery stores, warehouse clubs) where convenience store snacks and drinks would compete directly, and retailers whose brand doesn’t allow for generic convenience store aesthetics alongside their main brand (Apple, IKEA, premium brands).
Walmart-Murphy USA represents this model. Murphy USA stations at Walmart locations have fuel pumps but the convenience store merchandise is limited to fuel-related items (windshield fluid, motor oil, car air fresheners). Most food and drink purchases happen inside the Walmart Supercenter. This prevents cannibalization—Walmart captures all retail sales.
Economics of fuel-only partnerships differ slightly from traditional partnerships. The rent is lower because the fuel operator isn’t earning convenience store profit to offset land costs. Typical rent is $60-80K annually versus $100-150K for partnerships with convenience stores. The fuel operator’s returns come entirely from fuel sales, not convenience.
But the retailer’s traffic benefit is identical or better. Fuel customers still visit the retail location. In fact, eliminating the convenience store might increase main store traffic because customers can’t buy snacks at the pump—they must enter the main store. Walmart data shows that 45-55% of fuel customers enter the Supercenter during the same visit. That percentage might be lower if Murphy USA operated a full convenience store.
Traffic quality is the critical question. Are fuel-only customers as valuable as traditional fuel customers? Evidence suggests yes, if the retail format is destination shopping rather than convenience. Walmart, Costco, and Target are destination stores—customers plan visits, make large purchases, and spend 30-60 minutes browsing. Adding fuel captures those customers more frequently and incentivizes them to consolidate trips.
But a convenience store is a convenience format—customers make quick trips for immediate needs. For convenience stores, the fuel island should ideally have full convenience merchandise because the customer mindset is “fast and easy.” Separating fuel from convenience products reduces convenience, which contradicts the format.
Strategic fit determines whether fuel-only partnerships work. Destination retailers benefit from fuel-only because fuel drives additional traffic to the destination. Convenience retailers should avoid fuel-only because it creates friction in the customer experience.
Which Business Model Matches Your Retail Profile?
Selecting the right model requires honest assessment of your retail profile across five dimensions: capital availability, existing expertise, scale, risk tolerance, and strategic goals.
Capital availability determines which models are feasible. Direct ownership requires $1.8-2.5M per location, partnership requires $200-800K per location, and commission agent requires $50-100K per location. If you have limited capital, commission agent is your only option. If you have moderate capital, partnership makes sense. Only with substantial capital should you consider direct ownership—and even then, only if other factors align.
Small retailers with fewer than 50 locations should default to commission agent or limited partnership. You lack scale to justify dedicated fuel expertise. Major fuel operators won’t prioritize you for partnerships. You’re likely in secondary markets where fuel demand is moderate. Commission agent structure matches your constraints—minimal capital, passive involvement, steady income.
Example profile: 25-store grocery chain in Midwest markets of 50,000-100,000 population. Annual revenue $180M. Available capital $2-3M. No fuel expertise. Strategic goal is incremental traffic without major complexity. Right model: commission agent arrangement at 10-15 high-traffic locations. Expected outcome: $900K-1.35M annual rent income, 8-15% traffic increase at those locations, minimal operational burden.
Mid-size retailers with 50-500 locations should pursue strategic partnerships with regional or national fuel operators. You have enough scale to attract quality partners. You have enough capital for meaningful deployment ($10-40M for 50-200 locations). You likely have some operational sophistication that transfers to managing partnership relationships.
Example profile: 120-store drugstore chain in Southeast markets. Annual revenue $850M. Available capital $20M. No fuel expertise but strong site selection and customer analytics capabilities. Strategic goal is defending against competition from Walgreens and CVS by adding fuel. Right model: partnership with regional operator like Spinx or RaceTrac at 40-60 high-traffic locations. Expected outcome: $7-12M annual benefit from fuel profit share and retail sales lift, 3-4 year payback, differentiated offering versus competitors.
Large retailers with 500-5,000 locations should pursue joint ventures or majority-owned partnerships with specialized operators. You have scale to justify building internal fuel expertise. You have capital to fund major deployment. You have negotiation leverage with top-tier operators.
Example profile: 800-store supermarket chain operating nationally. Annual revenue $6B. Available capital $100M+. Some fuel expertise from past small-scale attempts. Strategic goal is becoming a top-10 fuel retailer to compete with Kroger and Safeway. Right model: joint venture with major operator like BP or Shell where you own 51% and they own 49%, or partnership with Costco Fuel Group at 200+ locations. Expected outcome: $40-80M annual benefit, 4-5 year payback, top-10 fuel retail position.
Giant retailers with 1,000+ locations should consider vertical integration or majority JV structures. You have enough scale that building internal expertise is efficient. You might already operate some fuel locations. You can negotiate favorable terms with any partner.
Example profile: Walmart. 4,700 US stores. Annual revenue $420B. Unlimited capital access. Strategic goal is maximizing control and long-term optionality. Right model: mix of partnership (Murphy USA), direct ownership where strategic, and white-label arrangements depending on market conditions. Outcome: industry-leading fuel retail position.
Risk tolerance affects model selection independent of scale. Risk-averse retailers should avoid direct ownership regardless of capital availability. Environmental liability, regulatory complexity, and operational challenges create risks that destroy value even at large scale.
Risk-tolerant retailers with genuine operational expertise might attempt direct ownership if they have strong strategic reasons. But very few retailers meet this bar. Costco is risk-tolerant and has built fuel expertise over 25+ years, making direct ownership viable for them. But even Costco uses partnerships in some markets.
What Is Your Risk-Adjusted Return Profile?
Understanding risk-adjusted returns across models requires analyzing best-case, expected-case, and worst-case scenarios for each model, then weighting by probability.
Commission agent model risk-adjusted returns:
Best case (20% probability): Strong fuel demand, excellent agent performance, high retail traffic lift. Annual return: $150K per location. 10-year NPV at 8% discount: $932K against $70K investment equals 1,231% return.
Expected case (60% probability): Moderate fuel demand, adequate agent performance, moderate retail traffic lift. Annual return: $95K per location. 10-year NPV: $567K against $70K investment equals 710% return.
Worst case (20% probability): Weak fuel demand, poor agent performance, minimal retail lift, possible reputation damage. Annual return: $40K per location. 10-year NPV: $198K against $70K investment equals 183% return.
Probability-weighted return: (20% times $932K) plus (60% times $567K) plus (20% times $198K) equals $566K weighted NPV against $70K investment. Risk-adjusted return: 709% over 10 years.
The commission agent model has limited downside. Even in worst case, you earn positive returns because capital investment is minimal. This makes it attractive for risk-averse retailers.
Partnership model risk-adjusted returns:
Best case (15% probability): Strong fuel demand, excellent partnership execution, high retail lift, successful expansion to additional locations. Annual return: $320K per location. 10-year NPV: $1.88M against $400K investment equals 370% return.
Expected case (70% probability): Moderate fuel demand, good partnership execution, moderate retail lift. Annual return: $180K per location. 10-year NPV: $1.01M against $400K investment equals 153% return.
Worst case (15% probability): Weak fuel demand, partner conflicts, limited retail lift, possible partner bankruptcy requiring new partner search. Annual return: $60K per location. 10-year NPV: $302K against $400K investment equals -24% return (loss).
Probability-weighted return: (15% times $1.88M) plus (70% times $1.01M) plus (15% times $302K) equals $1.03M weighted NPV against $400K investment. Risk-adjusted return: 158% over 10 years.
Partnership has higher expected returns but also meaningful downside risk. Worst case actually loses money due to partner issues or market deterioration. This requires retailers to vet partners carefully and structure agreements to mitigate risks.
Direct ownership risk-adjusted returns:
Best case (10% probability): Strong fuel demand, no environmental incidents, excellent operational execution, EV charging adds upside. Annual return: $380K per location. 10-year NPV: $2.35M against $2M investment equals 18% return.
Expected case (60% probability): Moderate fuel demand, one minor environmental incident, adequate operational execution. Annual return: $240K per location minus $80K amortized environmental incident equals $160K. 10-year NPV: $875K against $2M investment equals -56% return (loss).
Worst case (30% probability): Weak fuel demand or major environmental incident or both. Annual return: $120K per location minus $180K amortized environmental incident equals -$60K loss. 10-year NPV: -$603K against $2M investment equals -130% return (wipeout).
Probability-weighted return: (10% times $2.35M) plus (60% times $875K) plus (30% times -$603K) equals $579K weighted NPV against $2M investment. Risk-adjusted return: -71% over 10 years (loss).
Direct ownership has negative risk-adjusted returns for traditional retailers because environmental liability destroys value in expected and worst cases. Only in the unlikely best case (10% probability) do returns justify investment—and even then, 18% return over 10 years is mediocre compared to alternative investments.
Scenario analysis should stress test each model against plausible future scenarios:
30% fuel demand decline scenario: Commission agent rent drops from $90K to $65K annually (still positive). Partnership returns drop from $180K to $120K annually (still positive). Direct ownership drops from $280K to $160K annually but environmental liability risk increases as older stations are stressed, potentially turning returns negative.
Major environmental incident scenario: Commission agent unaffected (agent bears liability). Partnership unaffected if contract properly transfers liability to operator (verify this). Direct ownership faces $800K incident cost destroying 3-4 years of profit.
Energy transition acceleration scenario: Commission agent can adapt by partnering with different agent operating EV charging. Partnership can adapt through contract renegotiation, though partner might resist. Direct ownership struggles with stranded asset risk.
Competitive intensification scenario: Commission agent rent might decline as fuel traffic drops. Partnership returns decline proportionally for both parties. Direct ownership has highest flexibility to respond through aggressive pricing, but thin margins limit options.
Stress testing reveals that commission agent model is most resilient to downside scenarios but has limited upside. Partnership model balances resilience with upside potential. Direct ownership has extreme variance—high upside if everything goes right, severe losses if key risks materialize.
Portfolio approach for large retailers means diversifying across models to balance risk. Deploy 60-70% of locations using partnerships (core model), 20-30% using commission agents (low-risk income), and 10% using direct ownership only at locations where you have specific strategic advantages (proprietary technology, unique customer base, exceptional site).
This portfolio structure captures partnership returns at scale, provides downside protection through commission agent locations, and tests direct ownership at limited scale without over-committing.
The 90-Day Model Selection Process
Selecting the right fuel retail model requires structured analysis, not rushed decisions. This 90-day process ensures you choose wisely.
Week 1-2: Internal capability assessment identifies what you’re good at and where gaps exist. Conduct management interviews with operations, finance, real estate, and marketing leaders. Ask: Do we have staff with fuel industry experience? Can we access $10M+ in capital at favorable rates? Do we have real estate in high-traffic markets? Is our customer base loyal and frequent? Are we strong at managing complex operations, or is complexity our weakness?
Document honestly. A drugstore chain might admit: “We’re excellent at site selection and customer marketing. We’re weak at 24/7 operations and regulatory compliance. We have $15M available capital. Our customer base is moderate frequency (2-3 visits monthly).”
Capital availability confirmation means securing actual financing commitments, not just projecting that capital “should” be available. Meet with your bank or credit facility provider. Get term sheets for fuel investment. Understand rates, covenants, and drawdown schedules. If capital isn’t truly available, adjust your model choice accordingly.
Week 3-4: Market analysis examines fuel demand, competition, and pricing in your target markets. Hire a fuel retail consultant ($15-30K for 30-day market study) or conduct analysis internally using public data. Key questions: What’s average fuel volume at competitor stations in our markets? What are typical fuel prices and margins? How saturated are our markets with existing fuel stations? Are there geographic gaps where fuel is undersupplied?
Competitor model identification involves visiting 15-20 competitor fuel locations and documenting their model structure. Is it direct ownership, partnership, or commission agent? Who’s the operator? How’s the customer experience? Take photos, note pricing, observe traffic. This reconnaissance reveals which models work locally.
Partner mapping creates a list of potential fuel operators for partnership or commission agent arrangements. Research major operators (Murphy USA, ExxonMobil, Shell, BP, regional players) and evaluate their partnership interest. Look at their current retail partnerships. Do they work with retailers like you? Are they expanding in your markets? Create a target list of 8-12 potential partners.
Week 5-8: Partner discussions begin with initial outreach to 8-12 potential partners. Send a one-page summary: “We operate 120 drugstores in Southeast markets. We’re evaluating fuel operations at 40-60 locations. We’re seeking partnership or commission agent arrangements. Are you interested?”
Expect 50% response rate. Half won’t be interested (wrong geography, wrong retail format, already partnered with competitors). Focus on 4-6 interested partners. Schedule calls, then in-person meetings. Share preliminary site list (top 40 locations with traffic data, demographic profiles, competitive analysis). Ask partners to evaluate sites and propose terms.
Term sheet negotiations happen in weeks 6-8. Partners will propose high-level terms: structure (partnership or commission agent), capital investment split, rent or profit share, term length, key responsibilities. Negotiate top priorities: pricing control, data sharing, exclusivity, exit rights. Don’t negotiate final legal language yet—just agree on principles.
Reference checks are critical. Ask partners for 3-5 current retail clients. Call those retailers. Ask: How’s the partnership working? Any regrets? What would you change? Has the partner met performance commitments? Have there been disputes, and how were they resolved? This due diligence prevents choosing problematic partners.
Week 9-10: Legal review involves sending term sheets to your attorney for detailed contract drafting. Budget $30-60K for legal fees. The attorney drafts a 40-60 page partnership or lease agreement covering all aspects: pricing, branding, data, exclusivity, exits, liability, capital, performance, revenue, expansion, marketing, technology, rent, governance, term, and disputes (the 17 points from earlier).
Expect 2-3 rounds of negotiation between your attorney and partner’s attorney. Each side proposes changes, counter-proposes, and eventually reaches compromise. This takes 3-4 weeks typically.
Week 11-12: Board approval (if applicable) requires presenting the final agreement to your board or executive committee. Prepare a 15-20 page deck covering: strategic rationale for fuel, model selection analysis, partner evaluation, financial projections, risk assessment, implementation timeline, and recommended approval.
Answer board questions thoroughly. Expect skepticism from directors unfamiliar with fuel retail. Provide comparables—show that 73% of retailers use partnerships, show case studies of successful launches, show risk mitigation strategies.
Announcement planning coordinates public communication. Will you issue a press release? Will you notify customers? How will you train store managers on fuel operations (if any involvement)? Schedule announcement for week 12, coinciding with contract signature.
Decision gates at weeks 4, 8, and 12 provide go/no-go checkpoints. Week 4 gate: Do we have strong sites, viable partners, and adequate capital? If no, stop here. Week 8 gate: Did term sheet negotiations produce acceptable terms? If no, consider alternative partners or models. Week 12 gate: Does the final agreement match our expectations? If no, don’t sign.
This 90-day process prevents impulsive decisions. Retailers who rush into fuel without structured analysis often choose wrong models or wrong partners, leading to the 40% failure rate within 18 months.
How Do You Negotiate Partnership Terms That Favor Your Retail Goals?
Negotiating favorable partnership terms requires understanding your leverage, prioritizing what matters, and avoiding common mistakes.
Leverage points determine negotiation power. You have leverage if you control scarce real estate (high-traffic locations in dense markets where finding new sites is difficult), bring exceptional customer traffic (10,000+ daily visitors, loyal customer base, frequent shoppers), have a strong brand that attracts customers independently (Costco, Walmart, Apple), or can offer multi-location commitments (50+ locations, providing scale for the partner’s investment).
Partners have leverage if they bring a strong fuel brand (Shell, BP, ExxonMobil recognized by customers), have operational expertise that’s hard to replicate (environmental compliance, fuel logistics, regulatory relationships), or if there are limited quality partners in your market (only 2-3 operators who meet your standards).
In practice, leverage is balanced. Retailers with great locations but weak brands negotiate from moderate strength. Retailers with strong brands but secondary locations also have moderate leverage. Negotiation is about finding mutually beneficial terms, not dominating the other party.
Term priorities should reflect your strategic goals, not generic preferences. If fuel’s purpose is driving traffic during specific hours, prioritize pricing control over rent level. If fuel’s purpose is steady income, prioritize rent level over operational control. If fuel’s purpose is customer data insights, prioritize data access over branding.
Most retailers fail to prioritize. They try to maximize every term—highest rent, most control, best data access, longest term security. This creates negotiation deadlock. Instead, rank your top 3 priorities and be willing to compromise on others.
Example prioritization for grocery chain: #1 priority is data access to link fuel and grocery purchases. #2 priority is pricing control for promotional strategy. #3 priority is brand visibility to reinforce grocery brand. Willing to accept lower rent or shorter exclusivity to get these three.
Common mistakes in negotiation include accepting standard terms without customization (every partnership is unique—don’t accept “this is our standard agreement”), ignoring exit clauses (you’ll want out eventually—negotiate exit rights upfront), under-specifying performance expectations (vague “maintain equipment properly” language causes disputes), failing to transfer environmental liability clearly (litigation over who pays for tank leaks is expensive), and negotiating only financial terms while ignoring operational terms (pricing control, data sharing, and brand visibility matter as much as rent level).
Negotiation tactics that work: competitive bidding among 3-4 partners (creates urgency and improves terms), pilot programs where you test partnership at 3-5 locations before full rollout (reduces both parties’ risk and builds trust), performance-based escalators where rent increases if partner meets traffic or quality targets (aligns incentives), and framing requests around mutual benefit rather than one-sided demands (“Data sharing helps both of us understand customers better” versus “We demand full data access”).
During negotiation, maintain multiple partner conversations simultaneously. Don’t focus exclusively on one partner until terms are finalized. Having alternatives gives you walking power if negotiation stalls.
Be willing to walk away. If terms don’t meet your priorities, it’s better to have no fuel than bad fuel terms. The wrong partnership destroys value. Walking away is a valid outcome if negotiation reveals the partnership won’t work.
What KPIs Should You Track to Ensure Your Model Is Working?
Tracking the right KPIs reveals whether your fuel operations deliver expected value. Different models require different KPIs.
Fuel volume is the foundational metric: gallons per day per location. Track overall average, track per-location variation (which locations overperform or underperform?), track trend versus market (are you growing faster or slower than market fuel demand?), and track per-pump efficiency (gallons per pump per day—should be 800-1,200 for efficient operations).
Commission agent model: You receive volume data from the agent monthly. Compare to your expectations. If you projected 2,500 gallons daily and actual is 1,800 gallons, investigate why. Is it weak demand, poor agent operations, or unrealistic projections?
Partnership model: You have access to real-time volume data through shared systems. Monitor daily. Volume drops might indicate equipment problems, pricing issues, or market changes.
Direct ownership: You control all data. Monitor hourly to optimize pricing and operations.
Retail conversion measures what percentage of fuel customers enter your retail store. This is the core strategic benefit of fuel. Track by linking fuel transactions to retail purchases through loyalty cards or payment card data.
Target conversion: 40-60% for destination retailers (grocery, warehouse clubs, drugstores). If actual is 25%, fuel isn’t driving traffic as expected. Diagnose why: Is fuel too far from store entrance? Are customers in a rush? Is weather bad? Are fuel-only customers different demographics than your retail customers?
Average basket size for fuel customers versus non-fuel customers reveals incremental value. Fuel customers should have larger baskets because they’re making planned trips, not impulse stops. If fuel customer baskets are smaller, you’re attracting wrong customer type.
Target: Fuel customer baskets 20-40% larger than non-fuel customers. If actual is only 10% larger, fuel isn’t attracting high-value shoppers.
Customer frequency measures visits per month for fuel customers versus non-fuel customers. Fuel should increase visit frequency. Costco data shows fuel members visit 2.3x per month versus 1.7x for non-fuel members—a 35% increase.
Track this through loyalty programs linking fuel and retail transactions. If fuel customers don’t visit more frequently, fuel isn’t changing behavior. They’re just buying fuel at your location instead of competitors but shopping elsewhere for retail.
Financial metrics vary by model:
Commission agent: Track rent payment reliability (are payments on time?), site maintenance quality (is agent keeping facilities clean?), and customer complaint volume (are agent operations causing reputation issues?).
Partnership: Track fuel profit share payments, retail sales lift from fuel traffic, total benefit per location (rent plus profit share plus retail lift), and ROI against your capital investment.
Direct ownership: Track gross margin per gallon, operating cost per location, net profit per location, environmental compliance costs, and regulatory incident frequency.
Partner performance metrics ensure operators meet standards:
Equipment uptime percentage: Target 98%+ (less than 7 days downtime per year). Track monthly. Downtime above 2% indicates poor maintenance.
Service quality scores: Survey customers or use online reviews. Target 4+ stars out of 5. Scores below 3.5 indicate problems.
Compliance incidents: Track regulatory violations, environmental exceedances, safety incidents. Target zero incidents annually. Any incidents require immediate investigation and corrective action.
Customer complaint volume: Track complaints about fuel operations. Target less than 1 complaint per 10,000 transactions. Higher rates indicate operational problems.
Compare performance across locations to identify outliers. If one location has 5% downtime while others have 1%, investigate that location specifically. If one location has 40% retail conversion while others have 55%, understand why.
When Should You Pivot to a Different Business Model?
Pivoting from one model to another is sometimes necessary when initial model selection proves wrong or when market conditions change. Recognizing pivot triggers prevents prolonged value destruction.
Trigger events for pivoting include persistent underperformance (fuel volumes 30%+ below projections for 12+ months despite market demand being normal), partner issues that can’t be resolved (repeated contract violations, operational failures, conflicts over strategy), market changes that invalidate your model (fuel demand collapse, energy transition acceleration, new competition), or strategic shifts in your core business (refocusing on core retail, divesting non-core operations, entering new geographies).
Underperformance diagnosis requires separating controllable from uncontrollable factors. If all fuel locations underperform, it might be market-wide demand decline (uncontrollable). If specific locations underperform, it might be poor operations (controllable) or site-specific issues.
A grocery chain using commission agents at 15 locations found that 5 locations had volumes 40% below expectations while 10 locations hit targets. The underperforming 5 all had the same agent—a small operator with poor equipment maintenance and inconsistent pricing. The grocery chain terminated that agent, signed with a better operator, and volumes recovered to target within six months. That’s pivoting within commission model (changing agents) rather than changing models entirely.
Partner conflicts that require model pivots are more serious. A drugstore chain partnered with a regional fuel operator for 25 locations. Two years in, the partner declared bankruptcy due to unrelated business losses. The partner’s bankruptcy trustee wanted to sell the fuel operations, potentially to a competitor. The drugstore chain faced losing control over fuel at their own locations.
They pivoted by buying out the bankrupt partner’s fuel assets at a 40% discount, essentially converting from partnership to direct ownership involuntarily. This wasn’t their preference, but bankruptcy forced the decision. They operated directly for 18 months while seeking a new partner, then signed with a larger operator and converted back to partnership structure. Total pivot time: 24 months. Cost: $8M to buy out old partner plus $2M in direct operation losses before finding new partner.
Market changes like energy transition acceleration might require pivoting from fuel-centric to EV-centric models. A retailer operating fuel under partnership might approach the partner about converting some pumps to EV charging. If the partner resists (because their business model is fuel-optimized), the retailer might terminate the partnership at those locations and sign with an EV charging operator instead.
Strategic shifts like private equity acquisition or merger often trigger model changes. If your company is acquired by a firm that wants simplified operations, you might pivot from partnership to commission agent to reduce complexity. Or if your company merges with a fuel-savvy operator, you might pivot from commission agent to direct ownership to leverage combined expertise.
Pivot paths vary by starting and ending point:
Commission agent to partnership: You’re currently earning $90K per location with minimal control. You want more control and higher returns. You buy out the agent’s lease (cost: $150-300K), invest $400K in infrastructure upgrades, and sign partnership with better operator. New annual benefit: $180K. Incremental investment: $550-700K. Payback on incremental investment: 6-8 years. Only pivot if you have capital and genuine need for more control.
Partnership to direct ownership: You’re currently earning $180K per location under partnership. You want maximum control and returns. You buy out partner’s equipment (cost: $800K-1.2M), hire operations staff, and operate directly. New annual benefit: $280K before environmental incidents. Incremental investment: $800K-1.2M. Payback: 8-12 years. Only pivot if you have fuel expertise and strong strategic rationale.
Direct ownership to partnership: You’re operating directly but losing money due to environmental incidents and operational complexity. You sell assets to partner (recovery: 40-60% of book value, creating a loss), and structure partnership going forward. Benefit: Eliminate operational burden, transfer environmental liability, stabilize returns. Cost: Write off stranded investment. This is often the right move when direct ownership clearly isn’t working.
Transition costs for model pivots include lease buyouts ($150-300K), asset sales at a loss (40-60% recovery rate), contract termination fees (typically 6-12 months of rent or profit share), rebranding if changing partners or models ($30-80K per location), management time diverted to transition (200+ hours senior management time), and temporary performance decline during transition (customers confused by changes, operations disrupted).
Case study of successful pivot: A regional convenience store chain operated 35 fuel locations using commission agent model. After five years, they realized commission agents weren’t maintaining quality standards. Customer complaints increased 40%. Mystery shopper scores dropped from 3.8 to 2.9 out of 5.0.
They decided to pivot from commission agent to partnership for their 15 highest-traffic locations, while keeping commission agent for 20 lower-traffic locations. The pivot took 18 months. They terminated existing agents at high-traffic locations (causing 6 months legal disputes and $120K settlement), invested $6M in infrastructure upgrades to meet partnership standards, signed with a national operator, and reopened upgraded locations.
First-year result: The 15 partnership locations generated $2.7M annual benefit versus $1.35M under commission agent—doubling returns. Customer satisfaction recovered to 4.1 out of 5.0. Mystery shopper scores reached 4.3. The $6M investment had 5.4-year payback. Meanwhile, the 20 lower-traffic locations stayed commission agent because partnership economics didn’t justify the investment there. This mixed model optimized for location-specific conditions rather than applying one model universally.
How Will Energy Transition Impact Your Business Model Over 15 Years?
Energy transition from gasoline vehicles to electric vehicles will reshape fuel retail fundamentally over the next 15 years. Your model choice today determines how adaptable you’ll be in 2040.
Demand trajectory for gasoline is flat-to-declining in developed markets post-2030. EV adoption is accelerating—US EV market share was 9% in 2023, 11% in 2024, projected 14% in 2025, 18% in 2026. By 2030, EVs could be 35-50% of new vehicle sales. By 2040, 70-90% of new sales.
But vehicle fleet turns over slowly. A gasoline vehicle purchased in 2025 operates until 2035-2040. Total gasoline demand declines gradually, not abruptly. Industry projections show US gasoline demand declining 1-2% annually from 2025-2035, accelerating to 3-5% annually from 2035-2045.
This means gasoline stations remain viable through 2040 but with declining volumes. A station selling 2,500 gallons daily in 2025 might sell 2,200 gallons in 2030, 1,800 gallons in 2035, 1,200 gallons in 2040. Lower volumes mean lower revenue but fixed costs remain, squeezing margins.
Model resilience to demand decline varies. Commission agent bears the volume risk—their revenue declines, but your rent stays fixed (if structured as fixed rent) or declines proportionally (if percentage rent). Your exposure is limited. Partnership splits volume risk—your profit share declines as volumes fall, but partner bears operational cost pressure. Direct ownership gives you full volume risk—revenue declines while environmental liability and compliance costs remain fixed, potentially turning operations unprofitable.
Adapting to EV charging is easier under some models. Commission agent: terminate existing agent, sign with EV charging operator. Transition time: 12-18 months. Cost: agent buyout plus site conversion ($200-400K). Partnership: renegotiate to add EV charging alongside fuel, or terminate and sign with EV operator. Transition time: 18-24 months. Cost: negotiation plus conversion ($300-600K). Direct ownership: install EV chargers alongside pumps. Transition time: 6-12 months. Cost: $200-500K. Direct ownership has fastest pivot capability if you have capital.
Asset flexibility is critical. Underground gasoline storage tanks have 20-30 year useful life. Tanks installed in 2025 last until 2045-2055. But gasoline demand declines sharply after 2035. You face stranded asset risk—tanks with remaining useful life but insufficient demand to justify operations.
EV chargers have 10-year useful life before technology obsolescence. Chargers installed in 2025 need replacement by 2035 as charging speeds increase. But 10-year replacement cycles match demand evolution better than 25-year fuel tank cycles.
Partnership evolution requires renegotiation rights built into contracts. Include clauses allowing either party to propose EV charging additions every 3-5 years. Specify capital contribution formulas for technology additions. Define dispute resolution if parties disagree on technology transition timing.
Without these clauses, you’re locked into gasoline-only economics for 15-20 years while demand declines. Partner might resist EV charging because they’ve optimized their business for fuel. Renegotiating without contractual framework takes years and causes conflicts.
What Contract Clauses Protect You Against Energy Transition Risks?
Contract clauses anticipating energy transition prevent your partnership or commission agent arrangement from becoming obsolete as vehicle technology evolves.
Technology refresh requirements obligate your partner to upgrade infrastructure to support alternative fuels if commercially viable. Sample language: “Operator shall evaluate emerging alternative fuel technologies (including but not limited to electric vehicle charging, hydrogen fueling, renewable diesel) every three years and present a feasibility analysis to Retailer. If commercially viable (defined as IRR exceeding 12% over 10 years), parties shall negotiate in good faith to add such technology.”
This clause prevents partners from stalling on EV charging because it disrupts their fuel business. “Commercially viable” definition ensures you’re not forcing uneconomic investments, but genuine opportunities get implemented.
Early termination rights tied to fuel demand thresholds let you exit if gasoline demand collapses. Sample language: “If average monthly fuel volume drops below 1,500 gallons per day for six consecutive months, and market-wide fuel demand in the region has declined by 30%+ from baseline, Retailer may terminate this Agreement upon 12 months notice without penalty.”
This clause protects you if energy transition accelerates faster than expected. Without it, you’re locked into a 20-year agreement even as fuel becomes obsolete. The partner has termination rights too if demand collapses—they don’t want to operate unprofitable stations.
Alternative use provisions allow converting fuel space to other uses if fuel declines. Sample language: “Upon 36 months advance notice, Retailer may reclaim up to 40% of fuel station area for alternative uses including EV charging, retail expansion, or other commercial purposes. Operator shall remove fuel infrastructure at Operator’s cost and restore site to condition suitable for alternative use. Rent shall be reduced proportionally to area reclaimed.”
This gives you flexibility to adapt the site as energy mix evolves. Maybe you keep 4 fuel pumps and add 4 EV chargers on reclaimed space. Maybe you eventually close fuel entirely and expand retail store into that area.
Cost allocation for environmental remediation if station closes must be clear. Sample language: “If this Agreement terminates for any reason, Operator shall complete all environmental remediation required to close the fuel station in compliance with applicable laws. Operator bears all remediation costs up to $1M per location. Costs exceeding $1M shall be shared 50-50 between Operator and Retailer. Operator shall maintain insurance or financial assurance covering remediation obligations.”
This prevents you from inheriting cleanup costs if fuel operations wind down due to energy transition. The operator profited from fuel for years—they should bear shutdown costs. But $1M cap is reasonable because remediation occasionally exceeds that amount due to unforeseen contamination.
Data portability ensures you keep customer data if you switch partners or models. Sample language: “Retailer owns all customer transaction data including customer identities, purchase histories, and loyalty program information. Upon termination, Operator shall provide all historical data to Retailer in machine-readable format within 30 days. Operator’s use of customer data shall cease upon termination except as required by law.”
This prevents data lock-in. If you terminate partnership with Operator A and sign with Operator B, you bring customer data forward. Or if you pivot from fuel to EV charging, you maintain customer relationships.
Exclusivity limitations prevent partners from blocking your energy transition. Sample language: “Operator’s exclusivity under Section X applies only to gasoline and diesel fuel. Retailer may partner with third parties for electric vehicle charging, hydrogen fueling, or other alternative fuel technologies without Operator consent. Operator shall cooperate in integrating alternative fuel operations with existing fuel operations.”
This allows you to add EV charging through a different partner (ChargePoint, EVgo) even if your fuel partner isn’t moving fast enough. Without this clause, your fuel partner might claim exclusivity covers all “fueling” including EV charging, blocking your transition.
Performance metrics for environmental sustainability create accountability for future standards. Sample language: “Operator shall reduce greenhouse gas emissions from fuel operations by 20% by 2030 and 50% by 2035 compared to 2025 baseline, through measures including vapor recovery improvements, renewable diesel blending, and operational efficiency. Operator shall report emissions annually using EPA-approved methodologies.”
This ensures your fuel operations don’t become environmental liabilities as regulations tighten. Even if you don’t personally care about sustainability, governments and customers increasingly do. Having contractual commitments protects your brand reputation.
Technology upgrade capital sharing should be pre-negotiated. Sample language: “If parties mutually agree to add alternative fuel technology, capital costs shall be split 50-50 up to $300K per location. Costs exceeding $300K require separate approval. Incremental profit from alternative fuel technology shall be shared 50-50. If one party declines to fund their share, the funding party may proceed independently and retain 100% of profit from that technology.”
This prevents deadlock where both parties want EV charging but can’t agree on terms. Pre-negotiated framework speeds execution.
These clauses add complexity to contracts but provide essential flexibility for 15-20 year partnerships that will span major energy transition. Negotiate them at the start when both parties are optimistic. Trying to add them later when conflicts emerge is much harder.
What Is Your Next Step to Select the Right Fuel Retail Business Model?
You’ve now seen detailed analysis of three core models (direct ownership, partnership, commission agent), hybrid models, model selection frameworks, negotiation strategies, performance tracking, pivot paths, and energy transition planning. Time to take action.
Immediate action this week: Download a model comparison calculator or build one in Excel. Create columns for direct ownership, partnership, and commission agent. Create rows for capital investment, annual revenue, annual costs, net profit, payback period, 10-year NPV, and risk-adjusted NPV. Input assumptions based on your actual situation—your capital availability, your expected fuel volume (research competitors), your retail traffic, your operational capability.
Calculate returns for each model. Which delivers best risk-adjusted returns given your constraints? That’s your starting point for model selection.
This week: Complete internal capability assessment using the questions from earlier. Gather your management team for 2-3 hours. Be brutally honest: Do we have fuel expertise? Can we access capital? Are our locations strong enough to attract good partners? What’s our risk tolerance? Document answers. This assessment determines which models are realistically feasible.
This month: Initiate partner discussions for 2-3 viable models. If your assessment shows you can handle partnership or commission agent but not direct ownership, focus on those two. Reach out to 5-8 potential partners. Share preliminary information about your locations, traffic, and goals. Schedule exploratory calls.
Expect that 50% won’t be interested. That’s normal. Focus on the ones who respond positively. Use this month to understand partner capabilities, terms expectations, and cultural fit. Don’t commit yet—just gather information.
This quarter: Finalize agreement and announce launch. If you started partner discussions in February, by April you should be negotiating term sheets. By May, you’re finalizing legal agreements. By June, you’re signing contracts and announcing publicly. First locations open in July-August after 8-12 weeks site construction.
This timeline assumes you’re pursuing partnership or commission agent. If you’re pursuing direct ownership, extend the timeline by 6-12 months because you need to build internal capabilities, hire specialized staff, and secure more complex permits.
Resources you’ll need: Fuel retail consultant for market analysis and partner evaluation ($15-30K for 30-60 day engagement). Legal counsel experienced in fuel retail ($30-60K for contract negotiation). Financial modeling specialist if you don’t have internal expertise ($5-10K for model building). Site assessment contractor to evaluate your locations for fuel suitability ($3-5K per location). Total professional services budget: $80-150K for a 40-60 location rollout. That’s 0.5-1% of total project costs—money well spent to avoid expensive mistakes.
For the complete strategy on retailers entering the fuel business, including permitting requirements, construction timelines, pricing strategies, loyalty program integration, and operational playbooks, see the main guide. That guide covers implementation details once you’ve selected your model.
Related analysis on profitability drivers, cost structures, and financial projections helps you build detailed business cases for board approval. Implementation checklists guide you through 90-day, 180-day, and 365-day execution plans ensuring smooth rollout.
The right fuel retail model transforms your business by driving traffic, increasing shopping frequency, and generating incremental revenue. The wrong model destroys value through stranded capital, operational nightmares, and environmental disasters. Choose wisely, negotiate carefully, implement thoroughly, and monitor relentlessly. That’s how retailers succeed in fuel business long-term.
Related Posts

Instagram for Business: How to Set It Up, What to Post, and How to Actually Get Customers From It

Indiana SOS Business Search: How to Look Up Any Indiana Business, Read the Results, and Know What to Do Next